Customer experience and customer support are the two key pillars for any product to thrive.
Where customer experience helps in gaining the customers, customer support helps in keeping them.
For most, the question that arises is, how do we make it happen? And, the answer is visibility. Visibility in user behavior, their interaction with your product, and issues that they face. Visibility helps us in taking proactive measures to ensure a smooth experience for end-users. But, various challenges arise in gaining visibility because of the complexities of systems nowadays.
Software today is complex and can have a lot of moving components for things such as logging & observability (New Relic, Datadog, and other Log Aggregators), cloud (AWS / Azure / GCP) for servers, Caching (Redis, KeyDB), Queues (RabbitMQ, SQS) for resource-intensive asynchronous work, feature flags (Flagsmith, LaunchDarkly), devices (Smartphones, Tablets, PCs), browsers (Chrome, Firefox, Safari, Edge, Not you IE), operating systems, and so on. The list is endless.
Such a complex composition means that even a basic production-ready application consumes a lot of services, aka Enterprise Platforms, each having different sets of technologies, processes, security, and best practices. Thus we can assume that even a basic app is an unnoticed amalgamation of many technologies. With many moving parts in such an application, there’s a higher probability of something going wrong.

In the current landscape, anything other than your code can be considered a moving part because you can’t control them fully. How would you ensure that the AWS doesn’t go down when you are in your deep slumber, to not get woken up from a PagerDuty call?
A perfect website with a perfectly-setup EC2 machine as a server with perfectly crisp code can go down if a data center loses its connectivity. We can’t do much in that case, apart from having a multi-cloud, multi-region solution. But what to do, if a third party that you use doesn’t have a multi-cloud multi-region solution?
This makes the software landscape scary. Your systems are prone to break even if you did nothing wrong. No guarantee per-se that whatever worked yesterday will work today, though it is a rare occurrence.
This brought us to monitoring anything & everything which we could, to figure out weak links in our SDKs, eradicate them, or replace them with something more stable, to give our users a smooth uninterrupted video meeting & conferencing solution. This also helps us in proactively finding the errors that are going unnoticed or are not yet reported.
How do we do that? We trace user journeys, log useful information, and have metrics to detect anomalies. This ability to observe the internal state of a system by examining its output (logs/traces/metrics) is called observability (o11y).
o11y can be achieved by collecting logs of the system, tracking interactions (traces), and building metrics on top of it. This helps in providing customer support as well as detecting errors/issues with our system beforehand.
In this blog, we will be covering the issues which we faced and how we came towards a solution.
Who are we?
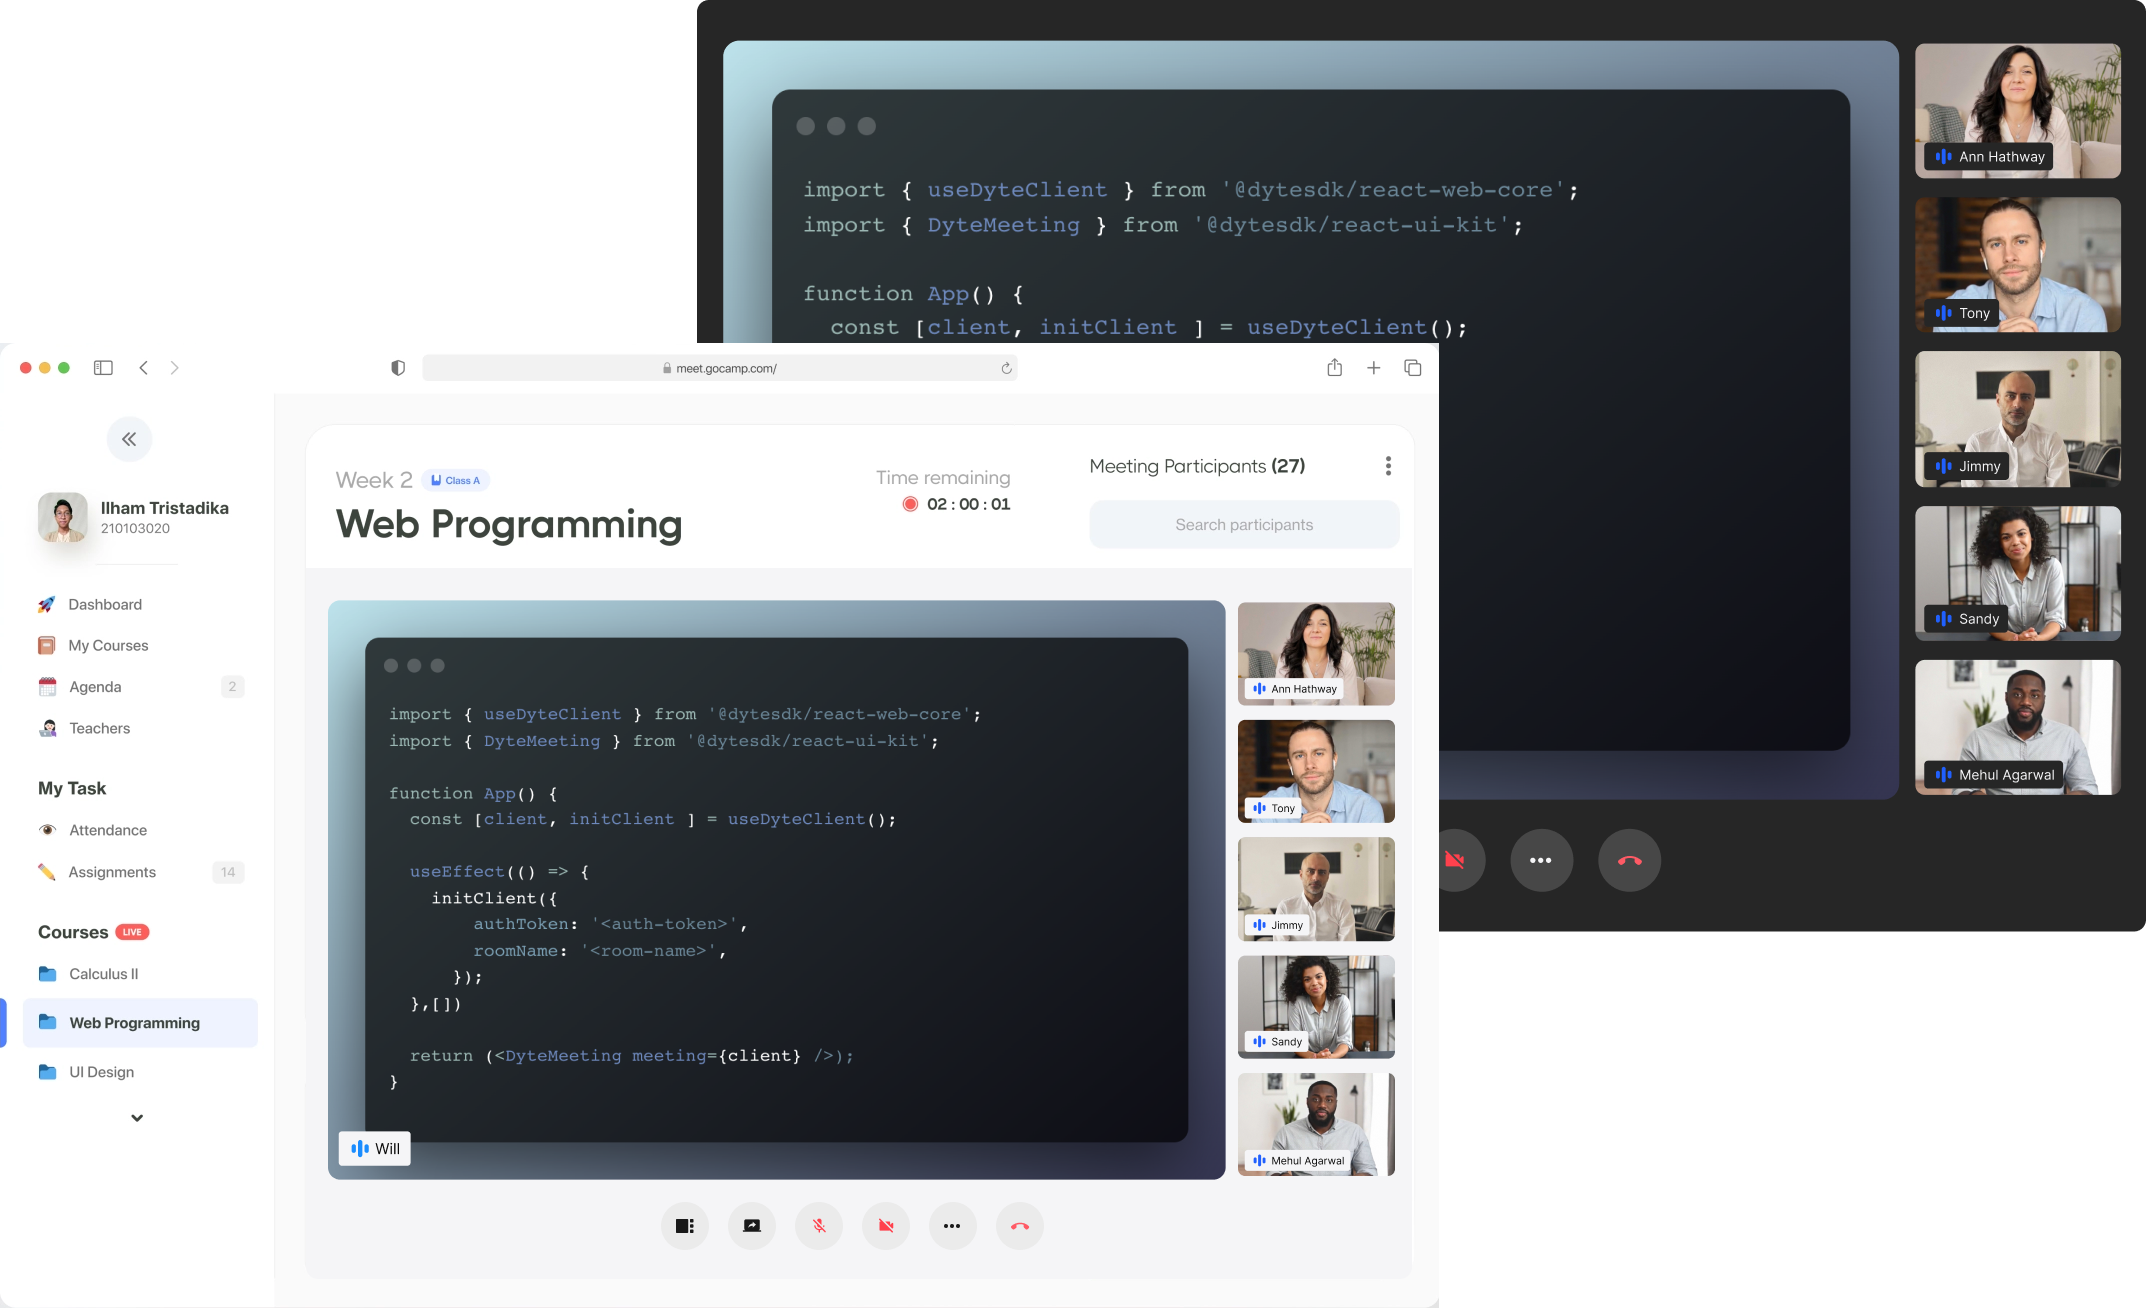
We, Dyte, are an Audio - Video SDK company. We provide easy-to-plug SDKs. With few lines of code, a developer can easily integrate our SDK to have an in-page meeting solution or you can redirect users to a page that contains just the meeting UI.
Being an SDK company means that we differ from a mainstream website. We do not usually have control of the website where our SDKs are being used.
For us, It is relatively easier to make changes in BE (backend) as we have total control of our BE infrastructure, however, it is way too costly for all parties if changes are on the FE side. Even costlier if it is a breaking change.
Why? Every client has a different set of build tools. Therefore, we cannot deploy a quick fix to all clients so easily or monkey-patch their applications/websites. It is up to our customers to upgrade their frontends to use our latest SDK. They do it at their own pace when the situation demands. It is not possible and ideal to ask our customers to stay updated with our SDKs on a weekly or even monthly basis. The development team of our customers needs to put some effort and time to migrate to our latest SDKs, test, and deploy their applications/websites. This diverts customers’ resources from their actual business needs, and they end up using their time avoiding issues with a third-party SDK. Nobody wants that.
So the best bet is to not make mistakes in the first place. The second best would be to proactively figure out issues and fix them in batches. The second worst situation would be when a client tests your product for you and comes with a new bug, every other day. The worst is when you don’t learn from it and keep fixing one bug after another when someone complains. Thus creating a new patch release every day.
A solution without a bug is a myth so we focused on the second-best. We looked for a solution that could help us find issues proactively.
Our expectations with a potential solution
As an SDK company, our needs were different from a website. We wanted a system:
- that is easy to integrate with our existing codebase which would not require a major overhaul, if we ever need to switch log aggregators. In other words, a vendor neutral system. We can’t afford to update & test 100s of call sites where we have logging statements to satisfy the APIs of a third-party log aggregator. We don’t want to go down if any of our third-party vendors go down.
- with which we could easily create and port dashboards, in case of a Log aggregator switch.
- with which, every log of our SDK could speak one language, one format. We needed a consistent log format & Logging standards.
- where we have the utmost control of what we can track on the user side. A blind automatic collection of all sorts of XHR (XMLHttpRequest) calls, WS (Websockets), and DOM (Document Object Model) wouldn’t work. We don’t want to capture data that doesn’t belong to us, such as customer secrets. User data is too sensitive and a lot of clients have strict regulations.
- that works well with Typescript.
- that is Open source would be a huge plus.
Based on these needs, OpenTelemetry was the most suitable candidate.
What is OpenTelemetry?
OpenTelemetry is a collection of tools, APIs, and SDKs. We can use it to Instrument (program), generate, collect, and export telemetry data (metrics, logs, and traces) to help us analyze our software’s performance and behavior. Feel free to check them out here.
OpenTelemetry is vendor-neutral. It is widely supported by a lot of industry-leading vendors. This gave us an option to switch with minimal changes if the situation demanded.
It might feel like a dream come true but the integration of OpenTelemetry came with its challenges.
Some of the challenges were as follows.
- OpenTelemetry documentation is all theory, with no proper working code samples at the time of writing this blog.
- No clear code samples even from vendors. You will find bits and pieces in tech blogs.
- Some specifications are under construction, therefore SDKs based on those specifications would take even more time to arrive.
- The package size of OpenTelemetry -related packages is huge. For instance, the FE trace exporter is 88KB approx as per bundlephobia. For an SDK, size matters a lot, the smaller the better. Having 6-10 such packages is a bit too much.
So our hunt began, we foraged every nook and corner and found very few working samples and hit many roadblocks. Most of the time working samples were not the best fit for us. Finally, after an arduous journey, we integrated OpenTelemetry into our SDKs. This simply worked and fulfilled our crucial visibility needs.
So how did we do this? And how can you get started? To figure that out, stay tuned. We will be back with part 2 of this saga.
If you haven’t heard about Dyte yet, head over to https://dyte.io to learn how we are revolutionizing live video calling through our SDKs and libraries and how you can get started quickly on your 10,000 free minutes which renew every month. If you have any questions, you can reach us at support@dyte.io or ask our developer community.