Optimal performance is crucial in the realm of web development. Users demand a smooth and responsive experience, and any latency can lead to frustration and abandonment. Thankfully, modern browsers equip developers with powerful tools to monitor and enhance performance.
One such tool is the PerformanceObserver API, a JavaScript interface enabling the observation of performance-related events. This guide comprehensively explores the PerformanceObserver API, specifically focusing on its application in tracking API performance.
While monitoring API performance on the server side is essential, it doesn't tell the whole story. What matters most is how long it takes for users to see results. Server metrics might show everything running smoothly, but if there's network lag or delays in processing user requests, the user experience suffers.
Tracking performance from the user's perspective helps identify real-world slowdowns that can lead to frustration and, ultimately, user abandonment of your application.
Understanding the PerformanceObserver API
The PerformanceObserver API builds upon the foundation of the broader Performance API. While the Performance API offers access to valuable performance-related information like timing metrics and navigation data, it often presents this data as a snapshot. The PerformanceObserver API elevates performance monitoring by enabling real-time observation and response to performance events. This empowers developers to delve deeper into various performance metrics, including resource timing, user navigation patterns, and server response times, all with a focus on providing a more granular and user-centric view of website performance.
Basic usage
Using the PerformanceObserver API typically involves creating an observer object and specifying which performance entry types to observe. Here's a basic example.
const apiPerformanceObserver = new PerformanceObserver((list) => {
  list.getEntries()?.forEach((entry) => {
        console.log('performanceEntry:: ', entry);
  });
});
apiPerformanceObserver.observe({ type: 'resource', buffered: true });
To try this out, head over to Dyte Demo. Once the page is loaded, paste the above code snippet into the developer console and hit enter. You will instantly see the buffered entries.
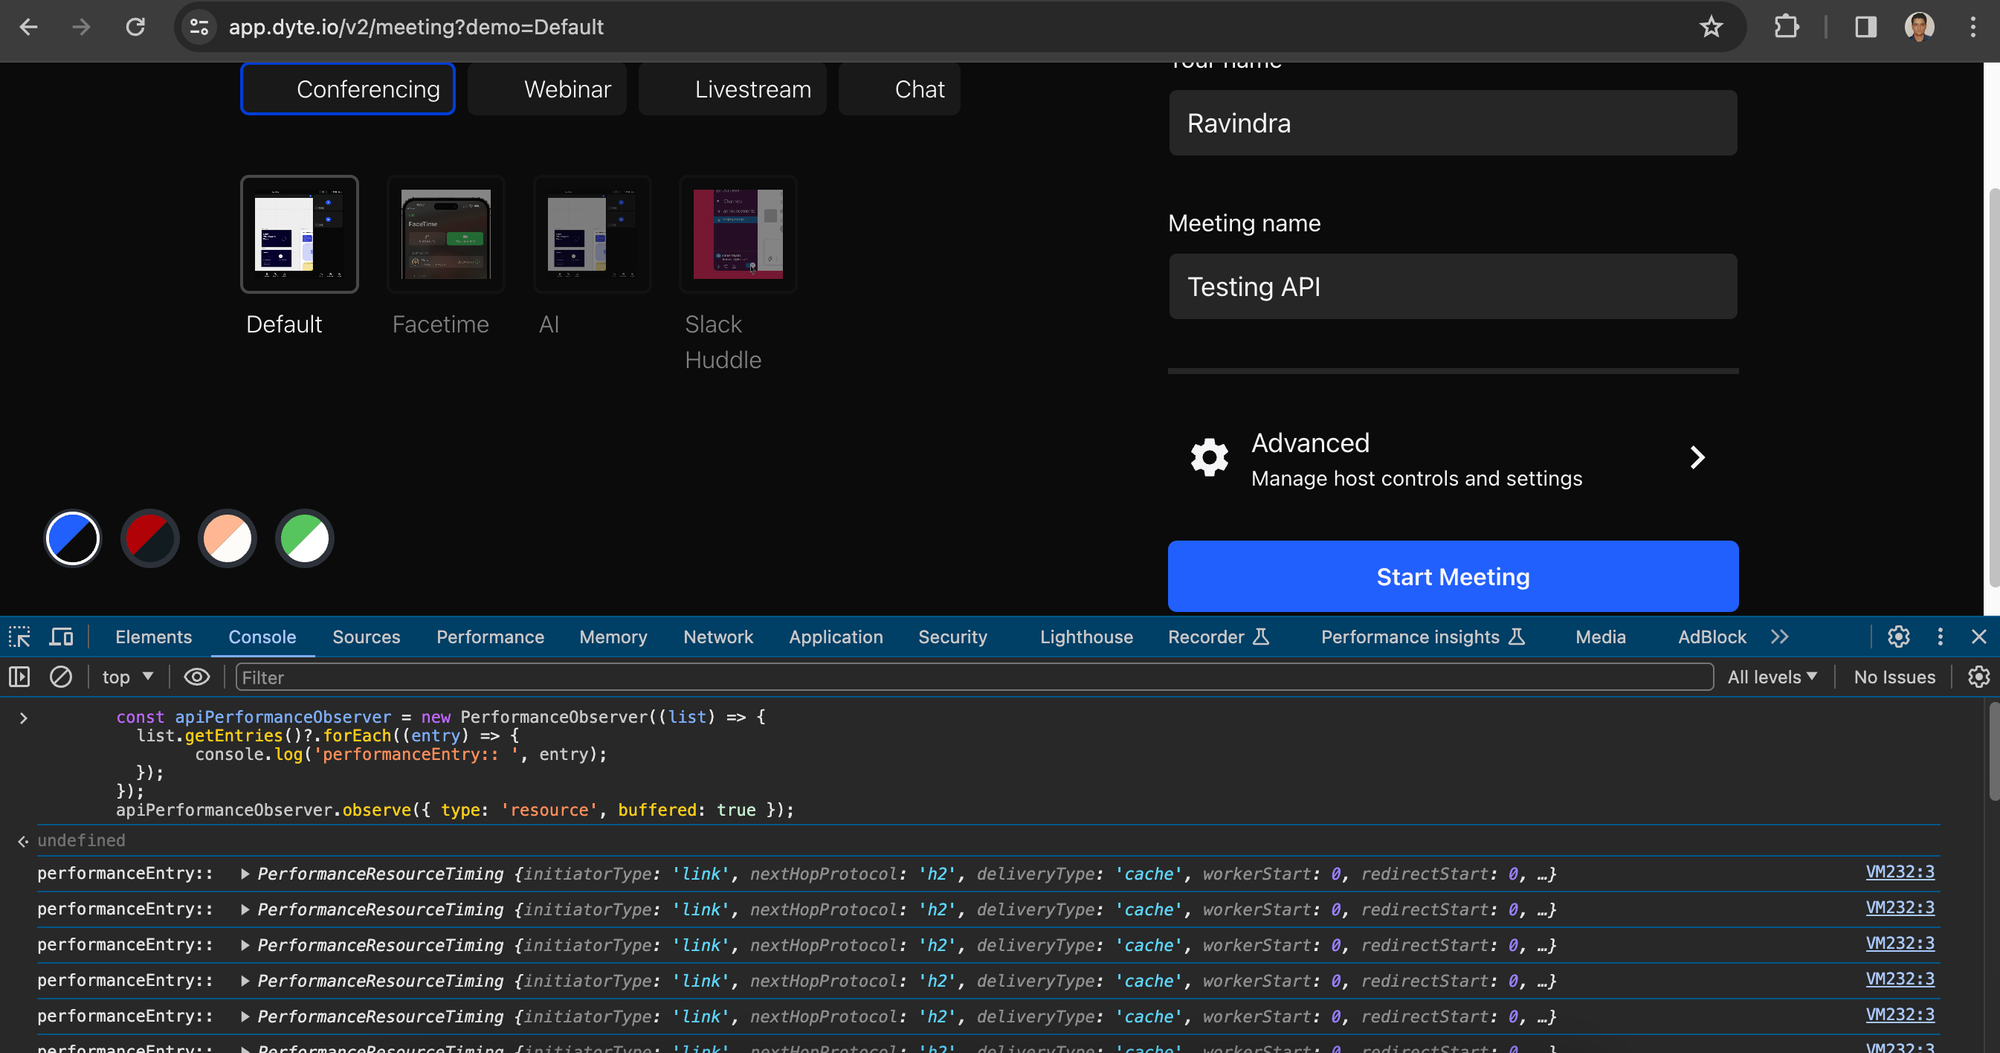
Provide any username and random meeting name and click on Start Meeting. You will see even more performance entries being console-logged.
Filtering out XHR & Fetch
If you only care about XHR & Fetch, you can filter those initiatorType out.
const apiPerformanceObserver = new PerformanceObserver((list) => {
  list.getEntries()?.forEach((entry) => {
    const performanceEntry = entry.toJSON();
    if (
      ['xmlhttprequest', 'fetch'].includes(performanceEntry.initiatorType)
    ) {
        console.log('performanceEntry Filtered:: ', entry);
    }
  });
});
apiPerformanceObserver.observe({ type: 'resource', buffered: true });
Notice the if condition, to filter out entries, based on the initiatorType. To learn more about initiatorType, please refer to this.
If you expand some of these entries, you will realize that nearly all have 0 as values for their keys, except the duration key, which is not ideal since we want the actual values. Let's discuss why this is happening and how to fix it.
Fixing data for cross-origin calls
Many resource timing properties are restricted to return 0 or an empty string when the resource is a cross-origin request. This is one of the security practices while dealing with CORS.
Since on Dyte Demo, Dyte is NOT sending the Timing-Allow-Origin response Header, you see most values as 0. This can be verified using the Network Tab.
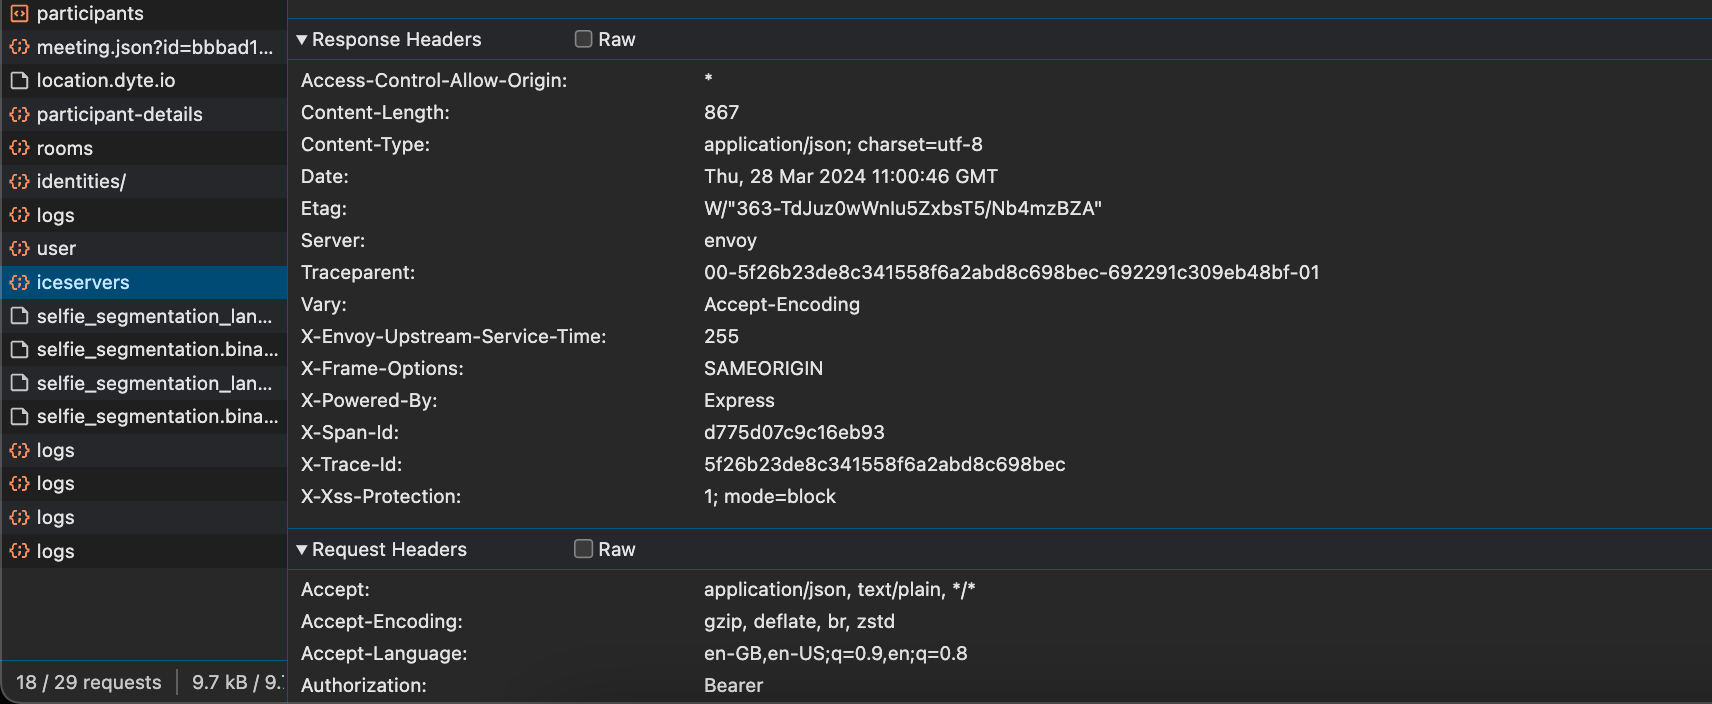
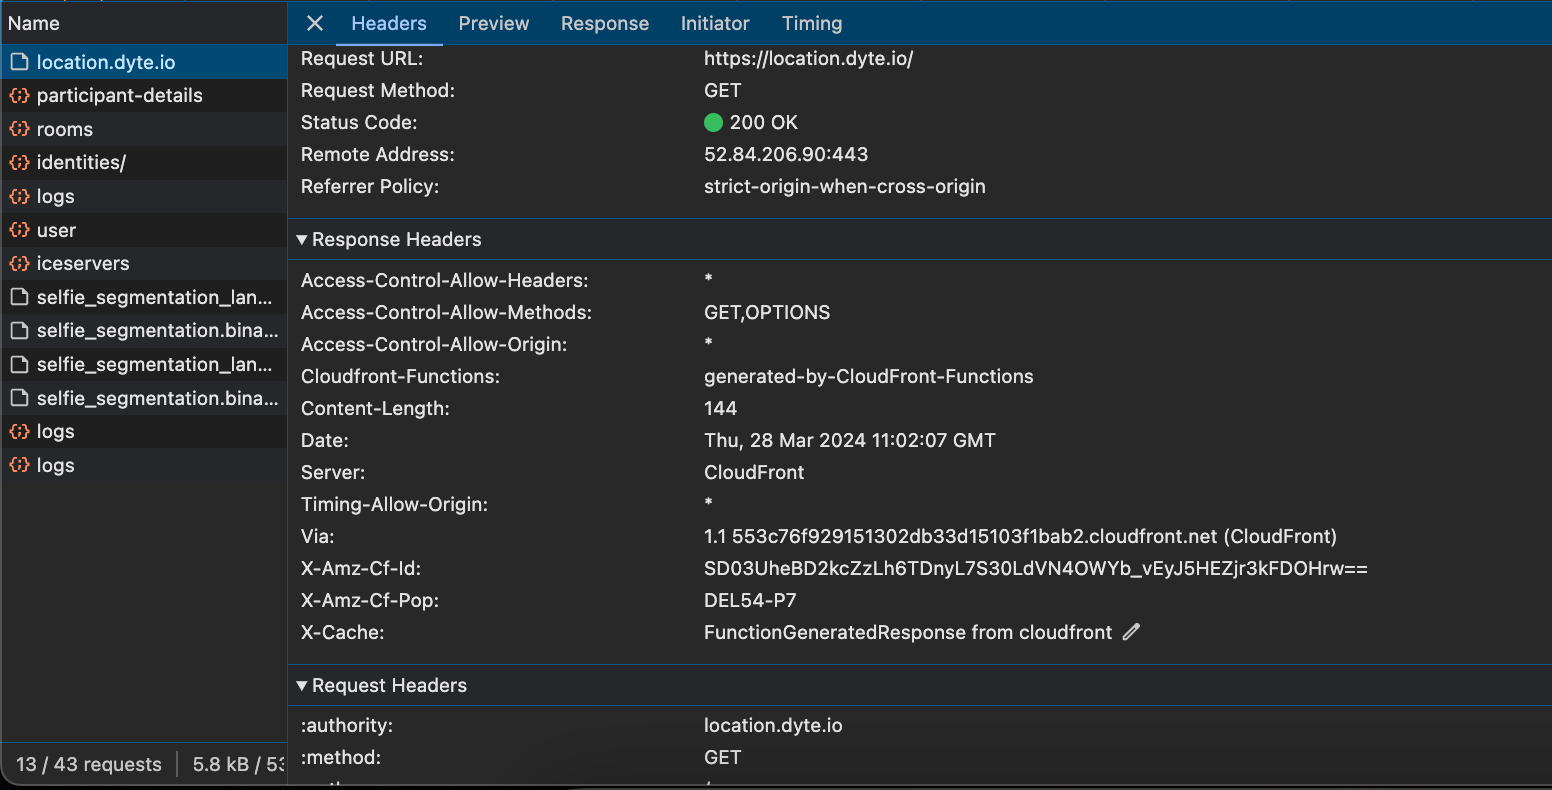
We are sending a Timing-Allow-Origin response header for one of the endpoints, location.dyte.io. The Performance Entry for this endpoint will have proper values.
(To learn more about this, check out our blog on building a fast IP location service.)
Since this happens for CORS requests only, To expose cross-origin timing information, we need to send the Timing-Allow-Origin HTTP response header using the backend codebase; only then can FE see the timing in the FE code.
You can add the Timing-Allow-Origin response header for your project in the following ways.
A NextJS config in the backend to return CORS response headers and Timing-Allow-Origin to every incoming call looks like this.
const nextConfig = {
    async headers() {
        return [
            {
                // matching all API routes
                source: "/api/:path*",
                headers: [
                    { key: "Access-Control-Allow-Credentials", value: "true" },
                    { key: "Access-Control-Allow-Origin", value: "*" },
                    { key: "Access-Control-Allow-Methods", value: "GET,DELETE,PATCH,POST,PUT" },
                    { key: "Access-Control-Allow-Headers", value: "X-CSRF-Token, X-Requested-With, Accept, Accept-Version, Content-Length, Content-MD5, Content-Type, Date, X-Api-Version" },
                    { key: "Timing-Allow-Origin", value: "*" },
                ]
            }
        ]
    }
};
For ExpressJS, it could be something like the following code snippet in a middleware.
app.use(function(req, res, next) {
    res.header("Access-Control-Allow-Credentials", "true");
    res.header("Access-Control-Allow-Origin", "*");
    res.header("Access-Control-Allow-Methods", "GET,DELETE,PATCH,POST,PUT");
    res.header("Access-Control-Allow-Headers", "Origin, X-Requested-With, Content-Type, Accept");
    res.header("Timing-Allow-Origin", "*");
    next();
});
Please refer to the security requirements here to learn more about this security constraint.
To send even more timing information (BE timing information such as DB fetch and cache Hit) to FE, you can pass the timing information using the Server Timing API.
Sample PerformanceResourceTiming Entry
If you have configured the response headers properly, you will see proper values for all the keys.
Here is one such sample.
{
    "name": "<https://location.dyte.io/>",
    "entryType": "resource",
    "startTime": 1041.699999999255,
    "duration": 61,
    "initiatorType": "fetch",
    "deliveryType": "",
    "nextHopProtocol": "h2",
    "renderBlockingStatus": "non-blocking",
    "workerStart": 0,
    "redirectStart": 0,
    "redirectEnd": 0,
    "fetchStart": 1041.699999999255,
    "domainLookupStart": 1071.199999999255,
    "domainLookupEnd": 1071.199999999255,
    "connectStart": 1071.199999999255,
    "secureConnectionStart": 1081.199999999255,
    "connectEnd": 1091.6000000014901,
    "requestStart": 1091.699999999255,
    "responseStart": 1102.3999999985099,
    "firstInterimResponseStart": 0,
    "responseEnd": 1102.699999999255,
    "transferSize": 444,
    "encodedBodySize": 144,
    "decodedBodySize": 144,
    "responseStatus": 200,
    "serverTiming": []
}
Making sense of the Performance Timing data
The above performance timing data is a snapshot for a resource. You can get typical resource timing metrics out of these entries/snapshots.
Measuring TCP handshake time (connectEnd - connectStart)
Measuring DNS lookup time (domainLookupEnd - domainLookupStart)
Measuring redirection time (redirectEnd - redirectStart)
Measuring interim request time (firstInterimResponseStart - requestStart)
Measuring request time (responseStart - requestStart)
Measuring TLS negotiation time (requestStart - secureConnectionStart)
Measuring time to fetch (without redirects) (responseEnd - fetchStart)
Measuring ServiceWorker processing time (fetchStart - workerStart)
Checking if content was compressed (decodedBodySize should not be encodedBodySize)
Checking if local caches were hit (transferSize should be 0)
Checking if modern and fast protocols are used (nextHopProtocol should be HTTP/2 or HTTP/3)
Checking if the correct resources are render-blocking (renderBlockingStatus)
Finally, you have this data in frontend. The next step is to send it to your BE endpoint to store it somewhere, e.g., NewRelic, DataDog, or DB, which we leave to you.
Performance API helped Dyte determine the timings of its new services, such as location.dyte.io, to see how well they were performing globally.
You can learn more about PerformanceResourceTiming here. To learn more about Performance API, please refer to these docs.
We believe these Timing metrics will also help you test and improve your services.
Lastly, I hope you found this post informative and engaging. If you have any thoughts or feedback, please get in touch with me on Twitter or LinkedIn. Stay tuned for more related blog posts in the future!
If you haven't heard about Dyte yet, head over to dyte.io to learn how we are revolutionizing communication through our SDKs and libraries and how you can get started quickly on your 10,000 free minutes, which renew every month. You can reach us at support@dyte.io or ask our developer community.