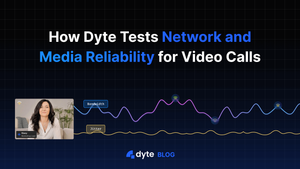
Our Video & Audio SDK provides a robust and reliable way for developers to add video and audio streaming capabilities to their applications. The SDK includes several features to improve network reliability, including automatic reconnection and error correction. We are constantly working to improve the SDK, and the network reliability features are a top priority. We are constantly testing and tweaking the algorithms to ensure that the video and audio streaming is as reliable as possible.
But how do we test different network conditions?
Tools at Dyte.
At Dyte, we have a bunch of internal tools, which, when put together, form a robust framework to test our SDK under different network conditions and improve it. Some of it includes
- Dyte Ultra Stress Testing tool (DUST)→ This is our ultimate stress testing tool, which is the heart of everything. It allows us to add hundreds and even thousands of bots to a Dyte meeting, using which we can test different scenarios like infra reliability, joining time for the participants, perform actions such as toggling audio, video, and screen share, simulate different network conditions and much more. DUST bots are deployed using a Selenium Grid. Selenium helps us test our product using an actual browser simulating a very real-world load. It has a lot of configurations, but the one we will be discussing in this blog post is its network conditions. We can configure at the network interface level stuff like packet loss, rate, delay, corrupts, etc to simulate different real-world network conditions. It internally uses
tcsetto add traffic control rules. - Callstats API→ Simulating is one part of the puzzle, we need to analyze the data as well. This is where the Callstats API comes in. It lets us monitor stuff like jitter, RTT, and frames dropped and provide an overall score. This is available to the general public as well. It internally uses
getStats()API which gives us a ton of information regarding the WebRTC call, we skim through it and provide a user-friendly graph to users as well. Read more about it here Developer Portal Revamp: Adding Quality Stats by Dyte.
All these things come together in a script that is periodically run to measure our improvements at Dyte. This includes but is not limited to the time it takes to join the meeting, how fast we recover from changes in network conditions, and how we react in certain network conditions.
Before jumping into the testing part, let’s discuss the various network conditions can occur for a user:
- Bandwidth → This is pretty simple; bandwidth is the total amount of data transmitted over a given time. The more, the better. Only bandwidth does not tell us the whole story, especially in the case of WebRTC, where a more reliable connection is better than a fast connection.
- Packet loss → Packet loss occurs when one or more data packets fail to arrive at the destination, reasons can be many, like network congestion, software bugs, old hardware, etc. More than 2% of packet loss creates a noticeable difference.
- Latency → Latency is when it takes a data packet to travel from one designated point to another. In an ideal world, we would want it to be as close to 0 as possible, but that's not the case. The lower the latency, the less perceived lag we would feel in our communication.
- Jitter → Jitter is the change in the amount of latency. Even if we have high latency the video and audio stream on its own would be smooth but if we have high jitter i.e. high variations in latency the packets will reach us in random order which results in a bad audio/video experience.
Let’s just dive straight into it
Test parameters
We are using our prod infra deployed in India-Mumbai region, and our bots are also joining in from the India region. Fun fact → we can even configure the region from where the bots join in DUST. This helps us test conditions like people joining in from US to a meeting hosted in India and analyze how much latency is there, how much time it took to join the meeting etc.
We will be adding 2 bots and 1 test user to capture the getStats() API manually.
Note→ you can compare the video quality of both the bots because they are deployed on the same node, thus affected by the same network conditions.
Here’s a base case scenario video and audio quality at 1mbps.
Since this recording is from a demo-users’s side, his network bandwidth will also play a role in audio and video quality.
Let's fiddle around with the rate and see what happens. Reducing it to 800kbps.
As we can see, there isn’t much decrease in anything. Why is that? If we observe the dump and our Callstats API, we can see we are already sending a pretty low-resolution stream, but why??
We use a Selective Forwarding Unit (SFU) on our backend because the demo-user bandwidth is limited. It does not send a very high-quality stream to the demo-user. This saves the bandwidth from both ends. We use simulcast to send multiple streams, and later on the client as well as on the server side, we decide which stream to forward considering the network conditions and resource usages.
Let's decrease the bandwidth even less to 500kbps.
Now we have some noticeable frame drops, but give it a few secs, and the video becomes fairly smooth, yes the quality is not that great, but the video is pretty smooth. It switched to a different layer. Different layer what??
We use VP9 codec, which enables us to use SVC i.e. Scalable Video Coding. SVC is a technique that allows the encoding of a video stream once in multiple layers. The layers make sure to maintain the video by reducing its quality with the reduction in each layer. This helps in routing mechanisms, especially in big meetings, where every member has a varied bandwidth.
Audio on the other hand pretty smooth.
What if we go even less to 400kbps?
At 400kbps, we see some noticeable frame drops at the start, but within 2-3 seconds it recovers. The video quality is not that great, but it's still playing, and the audio is still not breaking even at 400kbps.
300kbps wait, what?
Decreasing the bandwidth to 300kbps (let's be honest, at this point, we are just pushing the limits)
At the 300kbps mark, the video and audio are both gone, but that was expected.
We saw even with just 400kbps of bandwidth, one can do calls which is pretty great, and at around 500kbps, it was a pretty smooth experience on par or better than our competitors.
Let's try to simulate a load with a sudden decrease and increase in bandwidth.
It took around 8 seconds to adjust to the 500kbps bandwidth and around 12 seconds to get back up to the better quality. Keep in mind this includes the time it took to send the request from DUST to the Selenium node. At higher bandwidth. It quickly generates a new video stream with better quality and sends it.
Our backend infra and client are quick to respond to changes to handle any network conditions that may occur. We constantly monitor them and improve them.
Let’s take a look at the data that we collected.
You can skip to the next portion if the graphs feel a little overwhelming.
We talked very briefly about the manually collecting getStats() API. Let's talk some more about it. So Chrome has an internal tab chrome://webrtc-internals that holds statistics about ongoing WebRTC sessions. It can be used to capture and analyze data. You can read more about it here.
We can generate the dump of the whole test and play around with it using https://fippo.github.io/webrtc-dump-importer/.
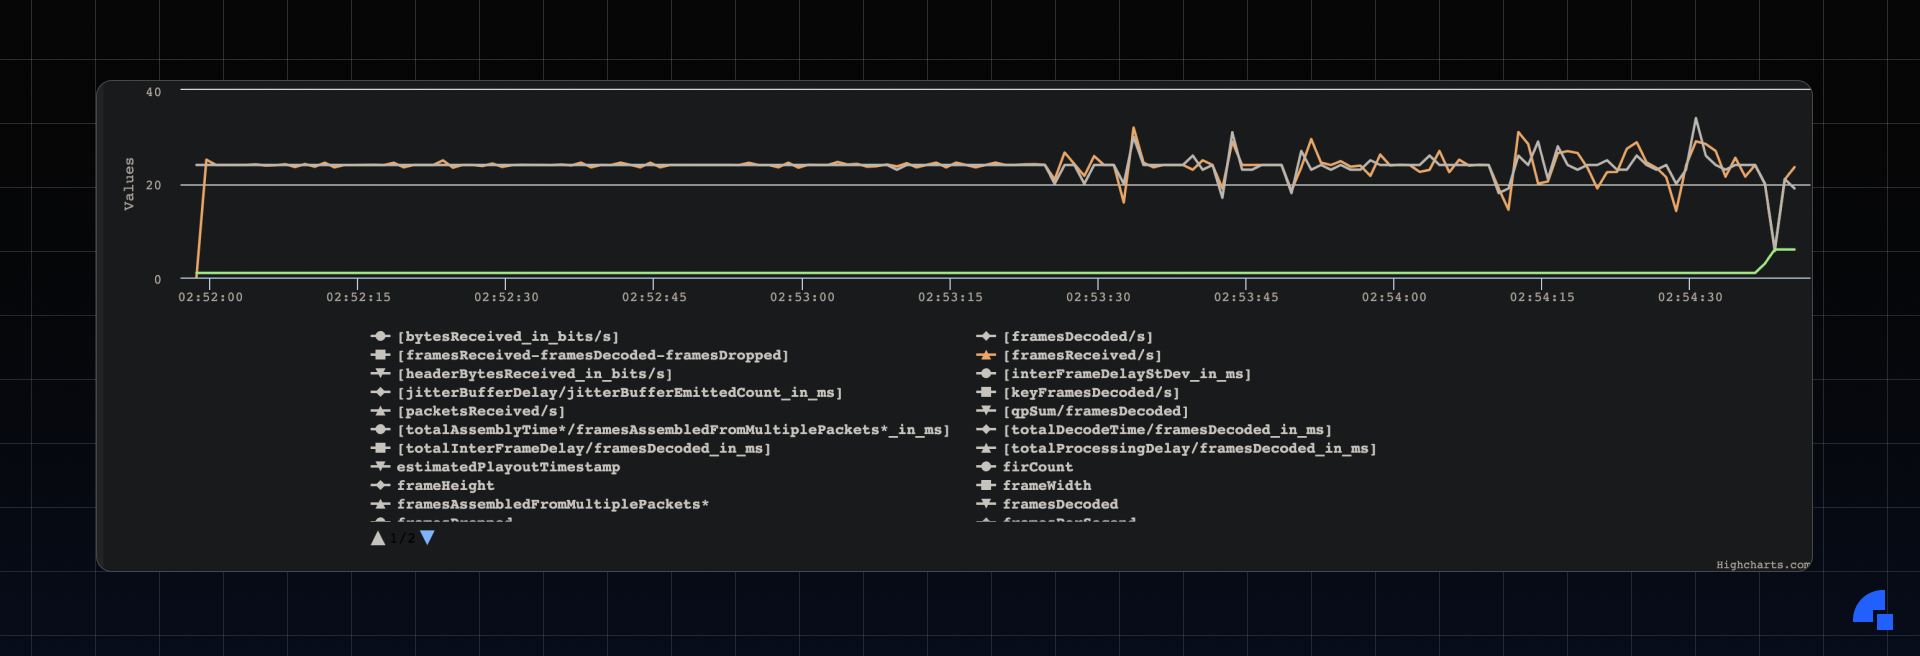
Green → Picture loss indicator (PLI) It is one of the error resiliency mechanisms in WebRTC; it is sent by the consumer whenever a media loses a full frame or more. We can see it was fired towards the end (when we tested 300kbps bandwidth).
Orange → Frames received/sec. It is fairly smooth, and even though there are spikes that are caused due to changes in bandwidth, it still tries to recover pretty smoothly.
Black → Frames/sec (FPS). FPS also tells a similar story, smooth overall and spikes when there is a sudden change in network bandwidth.
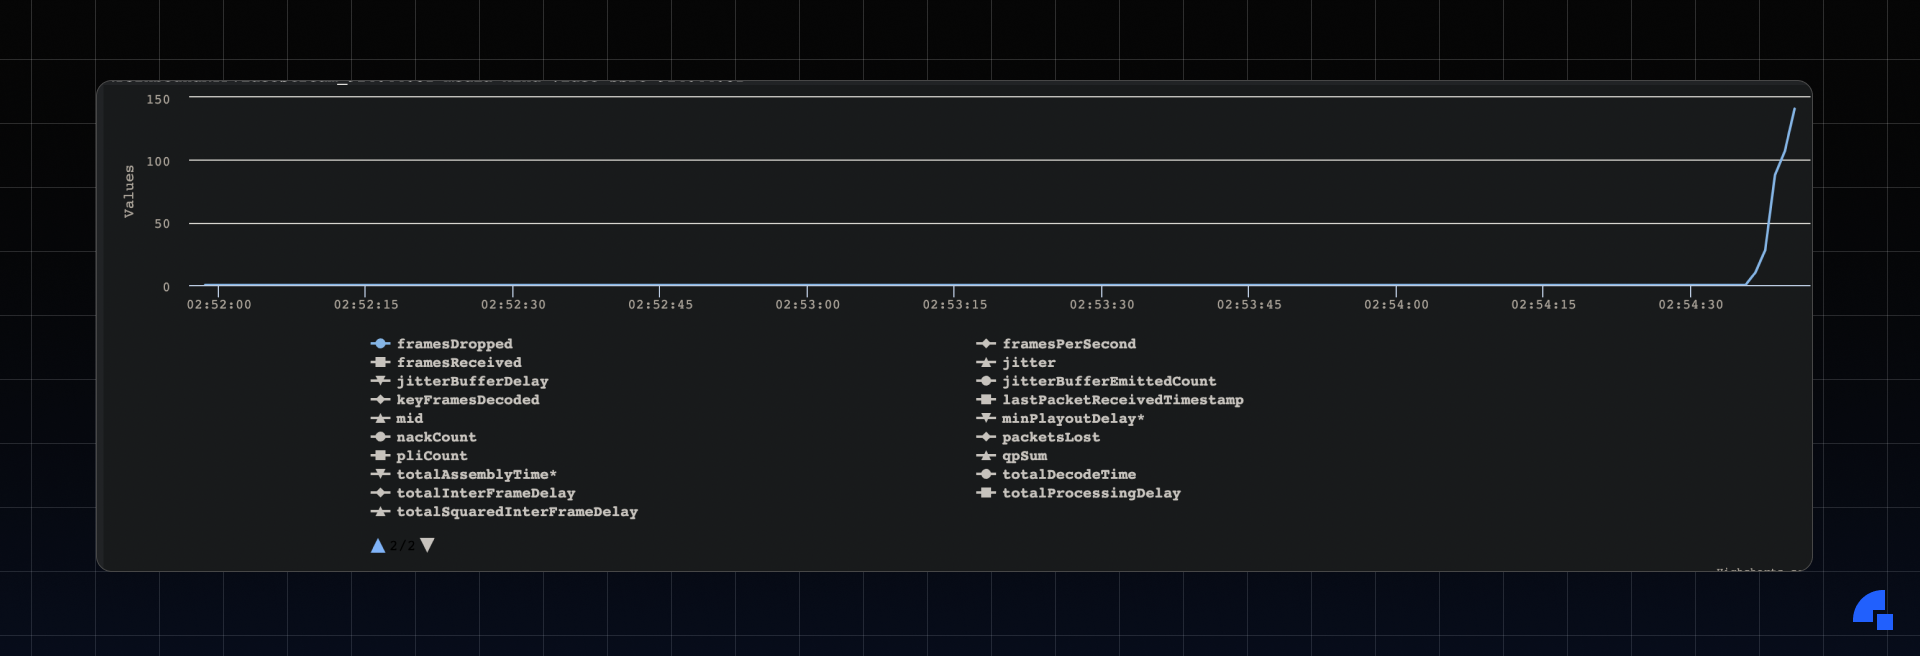
Blue→ FramesDropped. As we can see, the frames dropped increases towards the end when we pushed it to its limit (300kbps).
*The timestamps in the graph are in UTC.
Callstats Graph
Our CallStats graph provides a non-expert user-friendly graph that one can access through the dev portal.
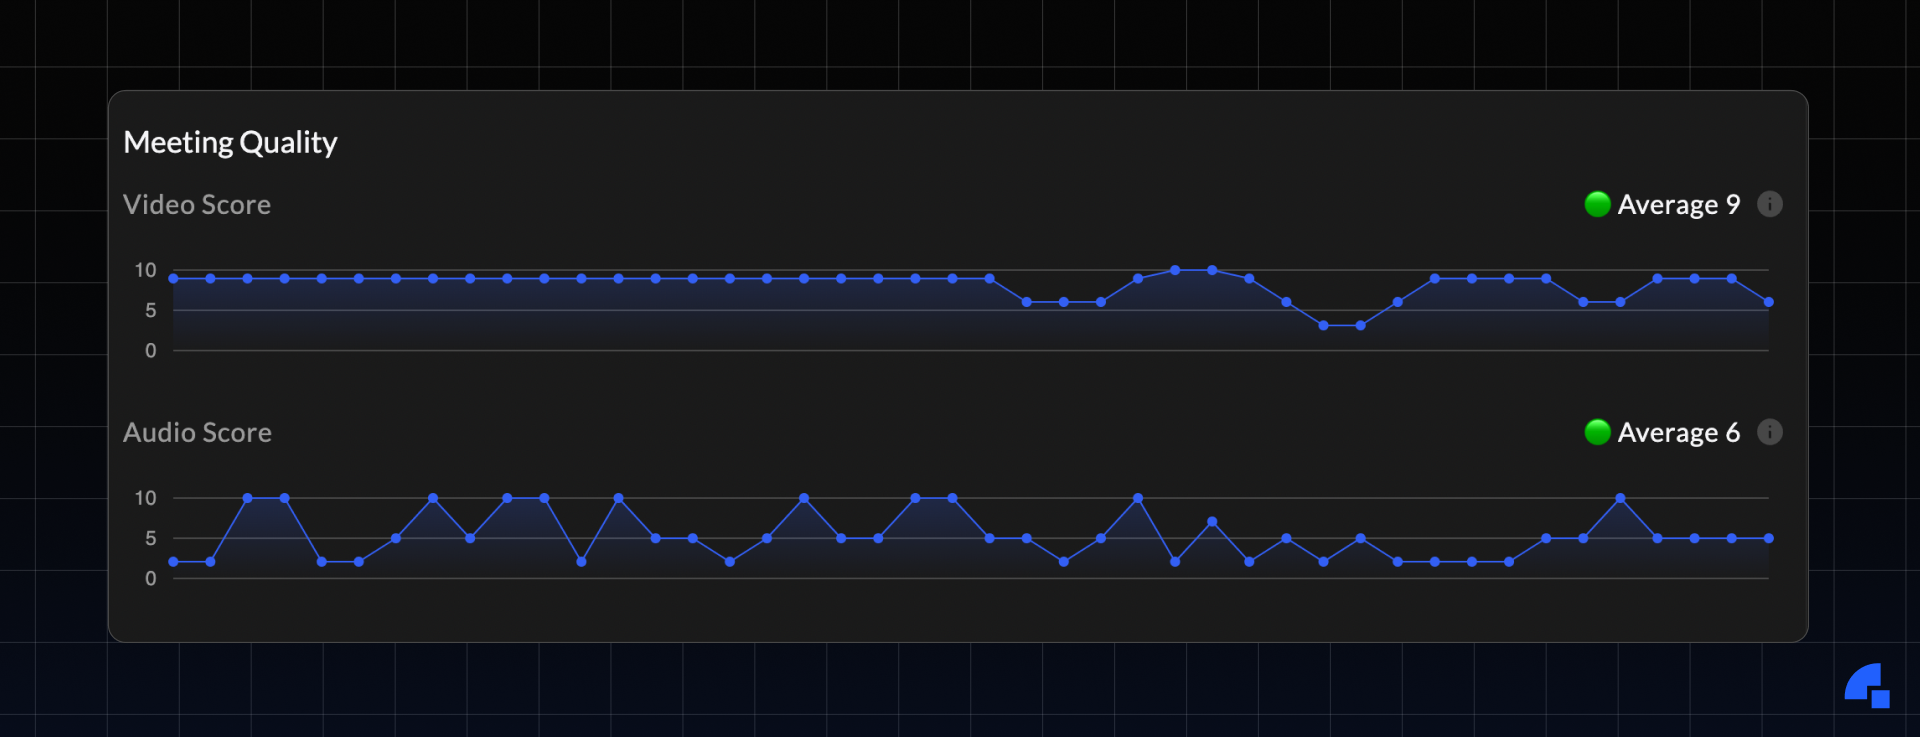
The score is calculated with a combination of jitter, resolution, FPS, frames dropped, and packet loss in case of video and, concealment events, packet loss and jitter in case of audio.
Summary
This blog post was to give you a fair idea of what goes behind testing our WebRTC stack against different network conditions and a glimpse of how fast we recover from such conditions. We have extensive measures to constantly improve the video/audio quality and reliability of our SDKs.
If you haven’t heard about Dyte yet, head over to https://dyte.io to learn how we are revolutionizing live video calling through our SDKs and libraries and how you can get started quickly on your 10,000 free minutes which renew every month. If you have any questions, you can reach us at support@dyte.io or ask our developer community.