Welcome to part 2 of How Dyte improves Performance & Reliability using OpenTelemetry?
In case you have missed part I, we would highly recommend you check it out here and return to this post. In part I, we discussed our search for a solution for achieving observability (o11y), how we came about OpenTelemetry, and the challenges we faced. In this blog, we will discuss OpenTelemetry integration for our frontend SDKs and how you can achieve it. Brew a cup of coffee (or tea, if that floats your boat) and settle in; this is a long post with a ton of technical info.
Prerequisites
Before deep diving into the integration, we highly recommend you go through https://opentelemetry.io/docs/concepts/ and spend some time familiarising yourself with the core concepts of OpenTelemetry. We know that the documentation is always boring to read, but it pays off in the long run.
We use New Relic as a log aggregator as we are already using it throughout our SDKs & backends, but this should work for any log aggregator you choose.
How to start with OpenTelemetry integration
TL;DR? Didn’t go through OpenTelemetry core concepts? No problem. We will still try to make it as easy as possible.
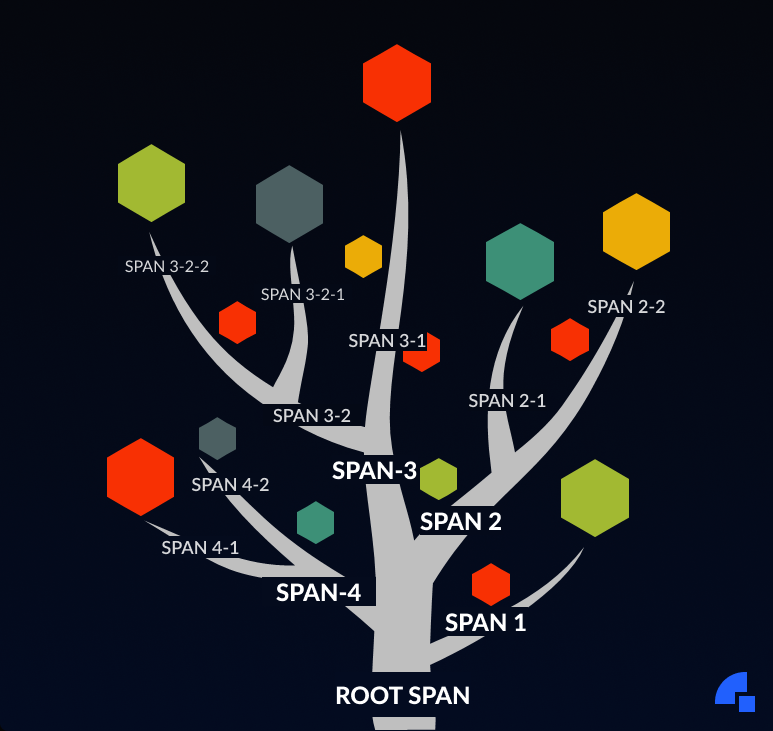
To grasp jargon quickly, let’s start with a simple analogy. In the context of a living, breathing tree, a single uniquely identifiable tree is a trace. The trunk of the tree from which branches originate is the root span (why not name it trunk span? Well… We want to stay deep-rooted 😀 also, data structure influence is there). Even these branches (spans) can have their own child branches (spans) as well.
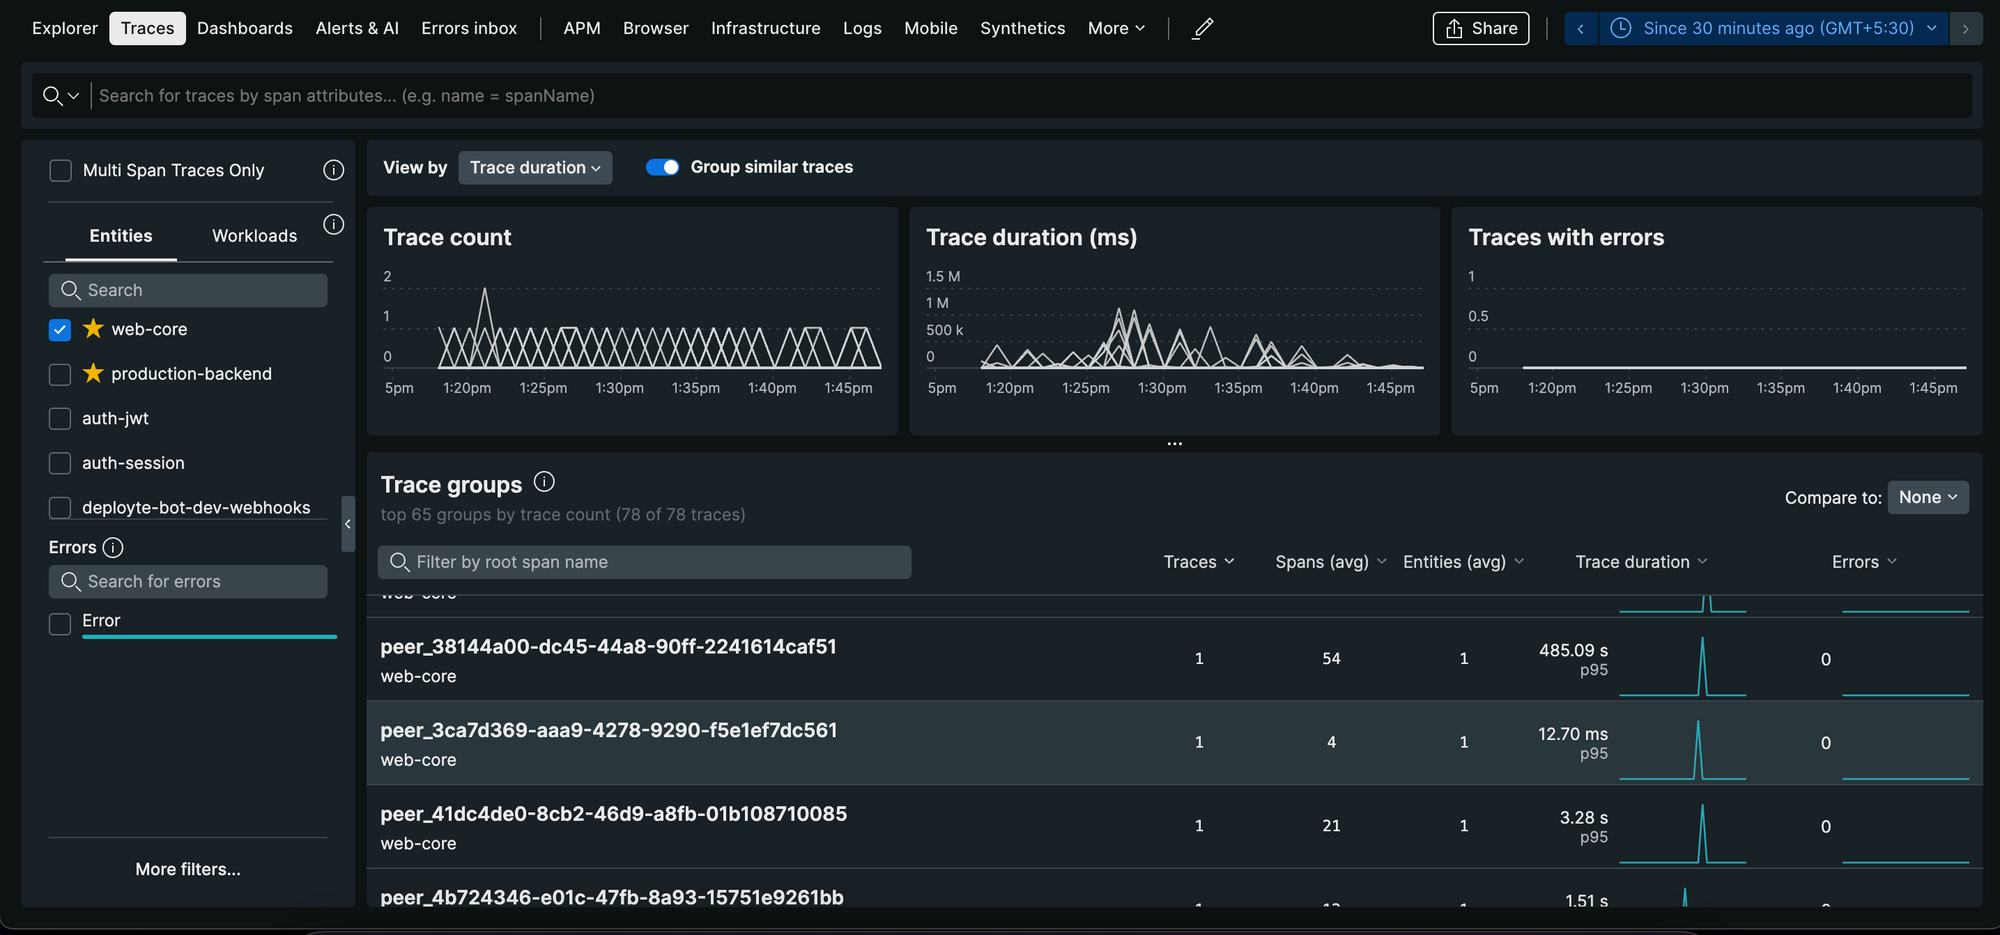
In the technical context, for our SDK, a participant joining a meeting, progressing further, and leaving it generates a single trace. If the same participant joins again, a new trace will be created. If 10 participants join a meeting, 10 traces would be created. If 5 of them leave and join the meeting again, it will result in a total of 15 traces. We name our traces peer_PEERID for easier individual retrieval. Peer Id is the unique UUID that we assign for every new session for a participant.
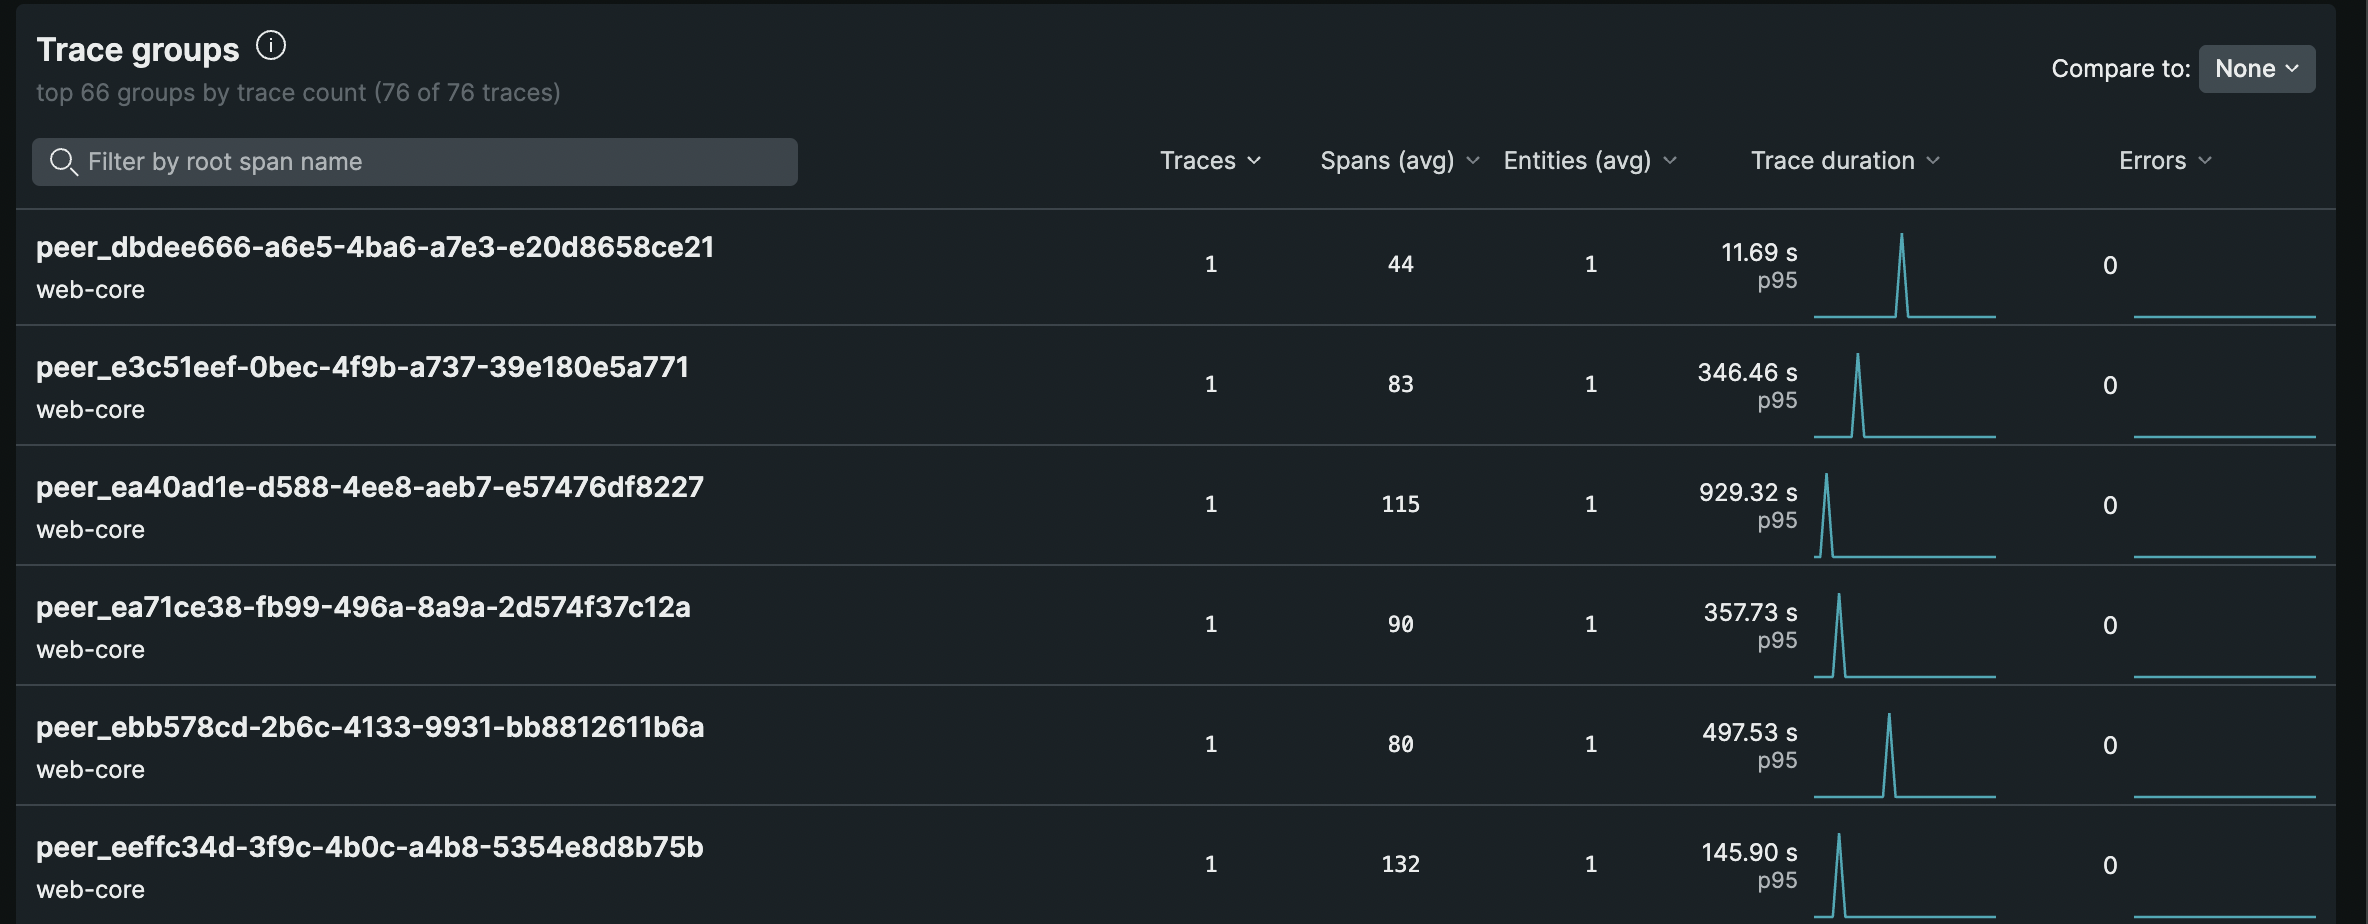
We are using New Relic’s distributed tracing to store our traces. As of now, we don’t group the traces. This helps us in getting a quick glance at the duration, and the errors count for a trace.
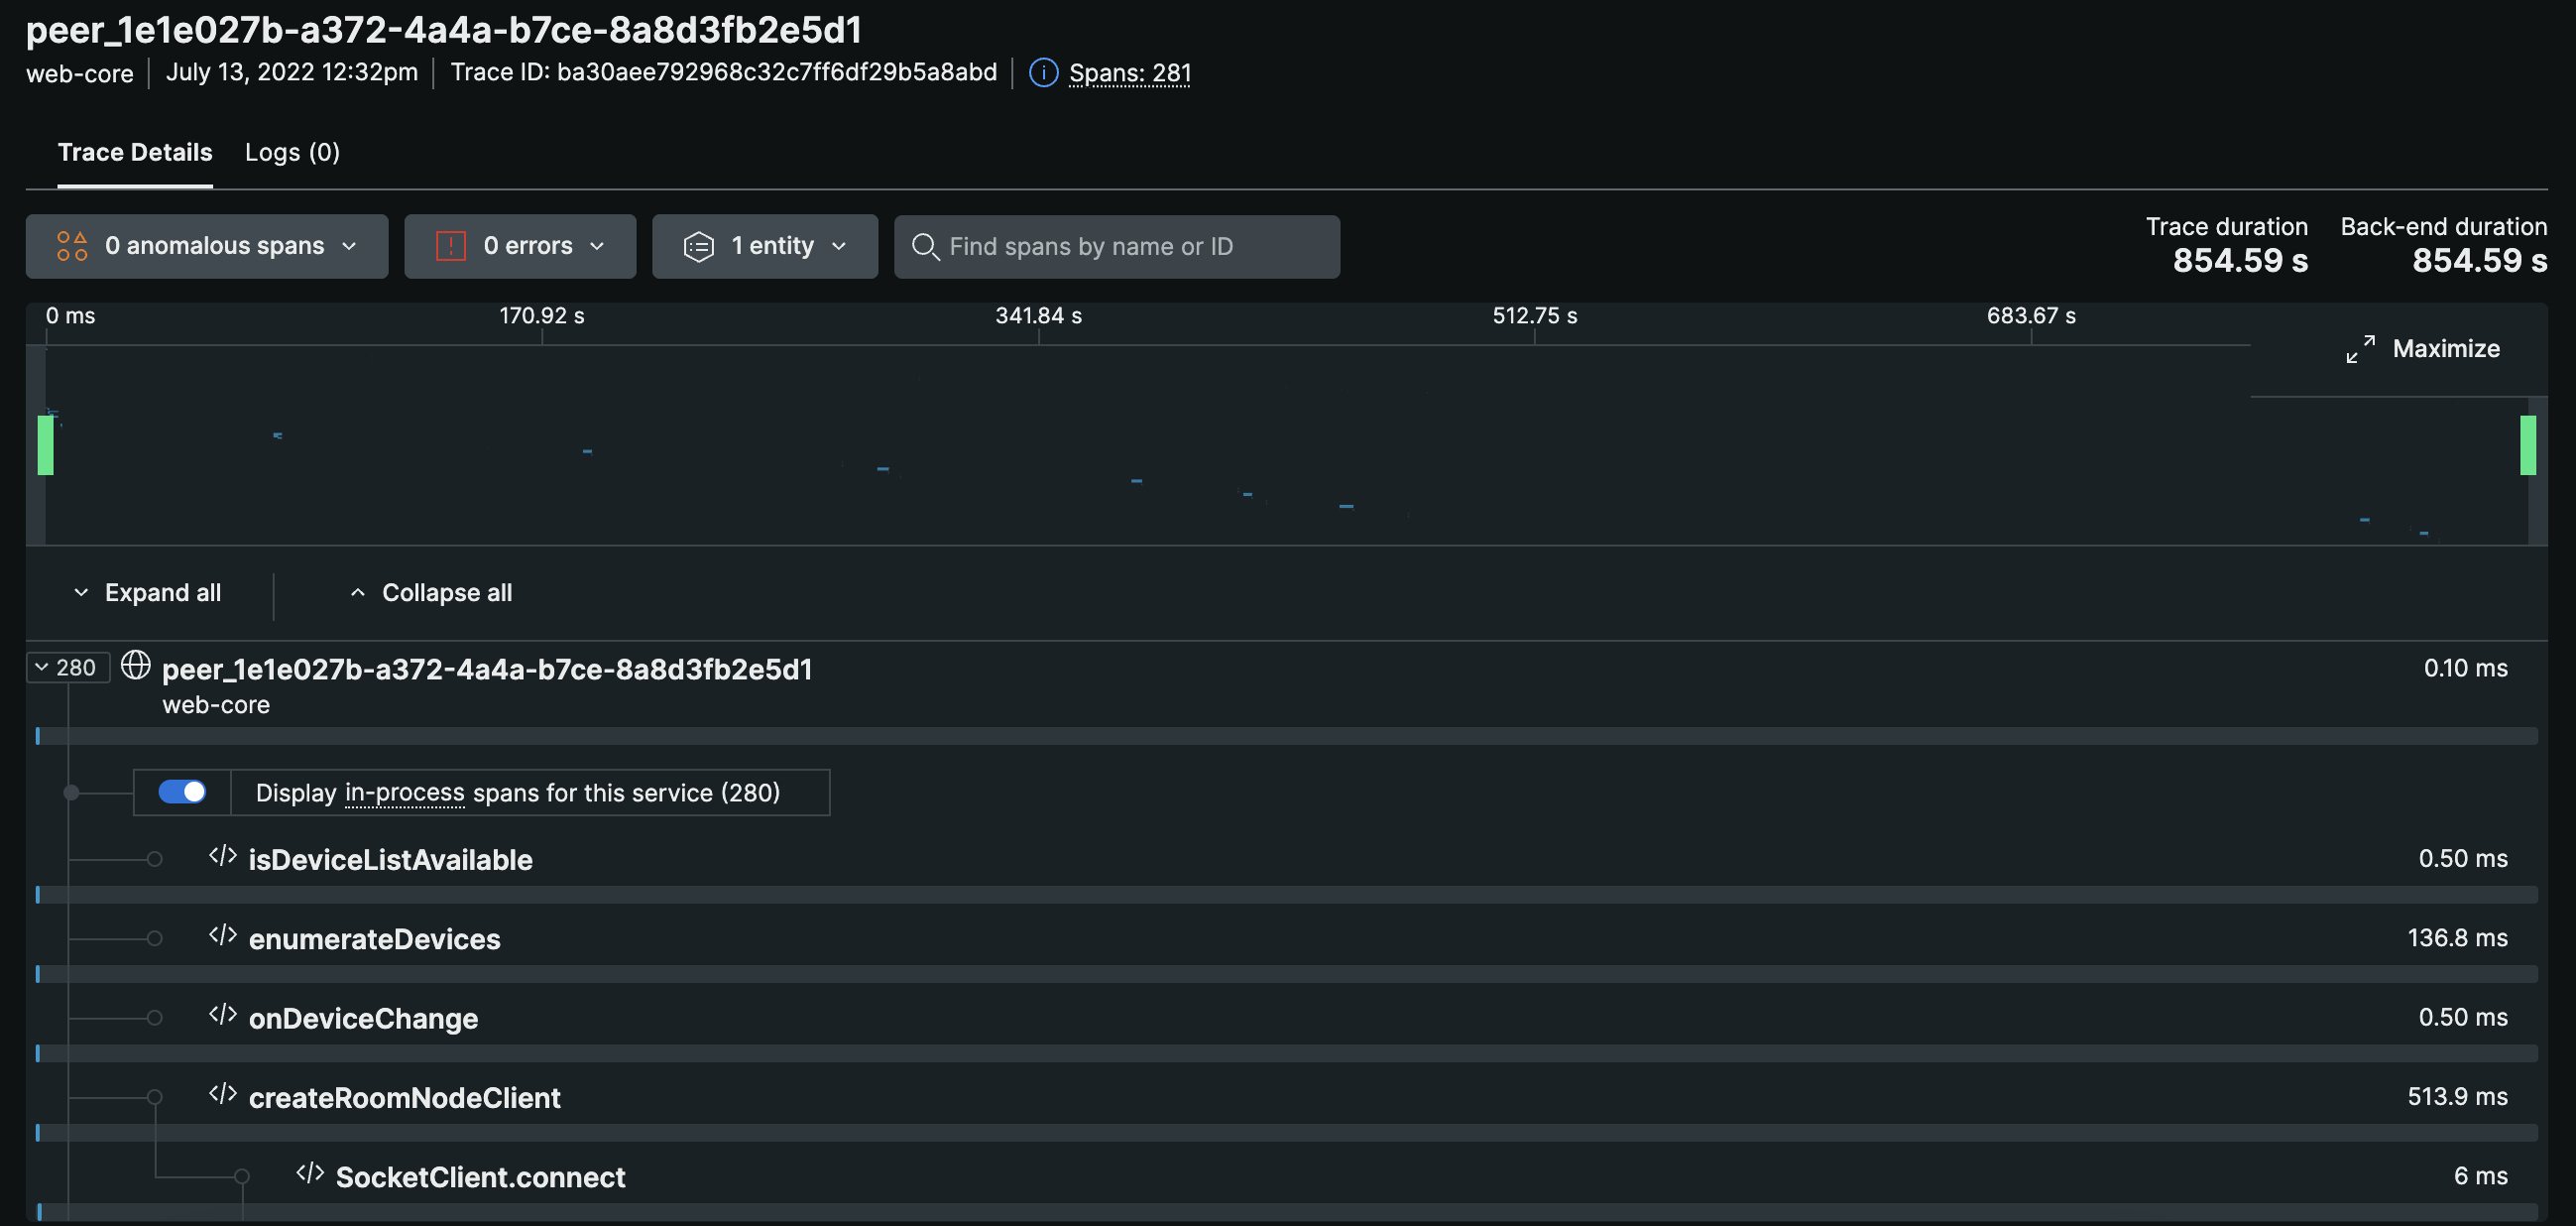
This inside view of a trace reveals all the internal spans/functions that were called and the time it took to execute them. This helps us in analyzing functions with errors and missing function calls. This also helps us determine a function's deviation in execution time from its peers. We can track sequential calls and figure out any instance that has occurred at a specific time.
Note: In the above image, root span (topmost) has a 0.10ms execution time. That is because of standard practices, which New relic suggests that a span should not stay open for long. It is just a holder span, so we are closing it instantly. We are naming this span root to avoid orphan spans (in the case of async function execution) for a better look and feel.
In a meeting, a participant clicks the camera and mic buttons to enable/disable the camera and mic. These actions are internally executing the Javascript/typescript functions referred to as spans. Now, these spans (functions) internally can call other functions, and we may want to track those as well, so in turn, those functions will become spans and get attached to their immediate parent.
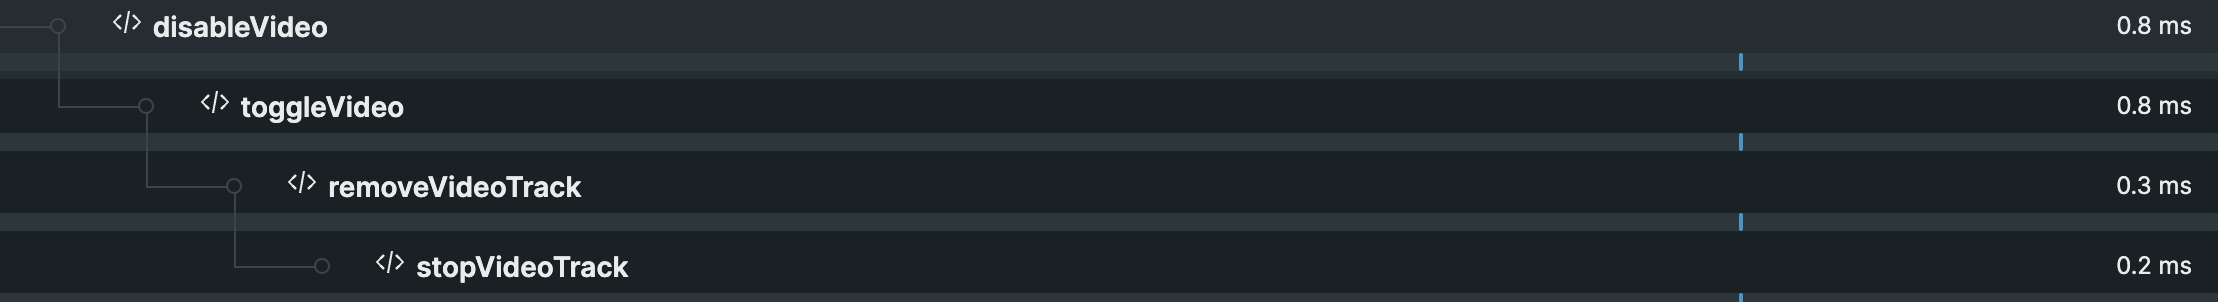
In the above image that depicts a portion of a trace, you can see disableVideo span attached to the root span (not visible in the image). disableVideo internally calls the toggleVideo function (another span), which internally calls removeVideoTrack (another span but under toggleVideo), which then calls the stopVideoTrack span/function & finally removes the video track.
We love this, it is exactly what we were looking for! With the help of tracing, we can see what happened when a user clicked on a button. Did the action go as expected? Or were there any errors? Did this error occur when the user clicked the button the first time, or did it always occur, or did it occur after some aggressive clicking (rage clicking)?
As a downfall, adding tracing libraries in frontend SDK increased the SDK size for us, but it was worth the extra KBs. In this blog, We will only cover the tracing portion of OpenTelemetry. We didn’t go ahead with logs and metrics integration because we were able to quickly achieve that by writing a small piece of code in our codebase without a third-party OpenTelemetry package thus reducing the overall SDK size.
Note: If you want to learn more about log integration, we can add a third part to this blog. However, for the time being, a quick tip can help you do it yourself. Quick Tip: Any log sent to New Relic becomes a distributed tracing log if it has trace.id, span.id and service.name fields.
Back to the tracing, this is what our reference architecture looks like.
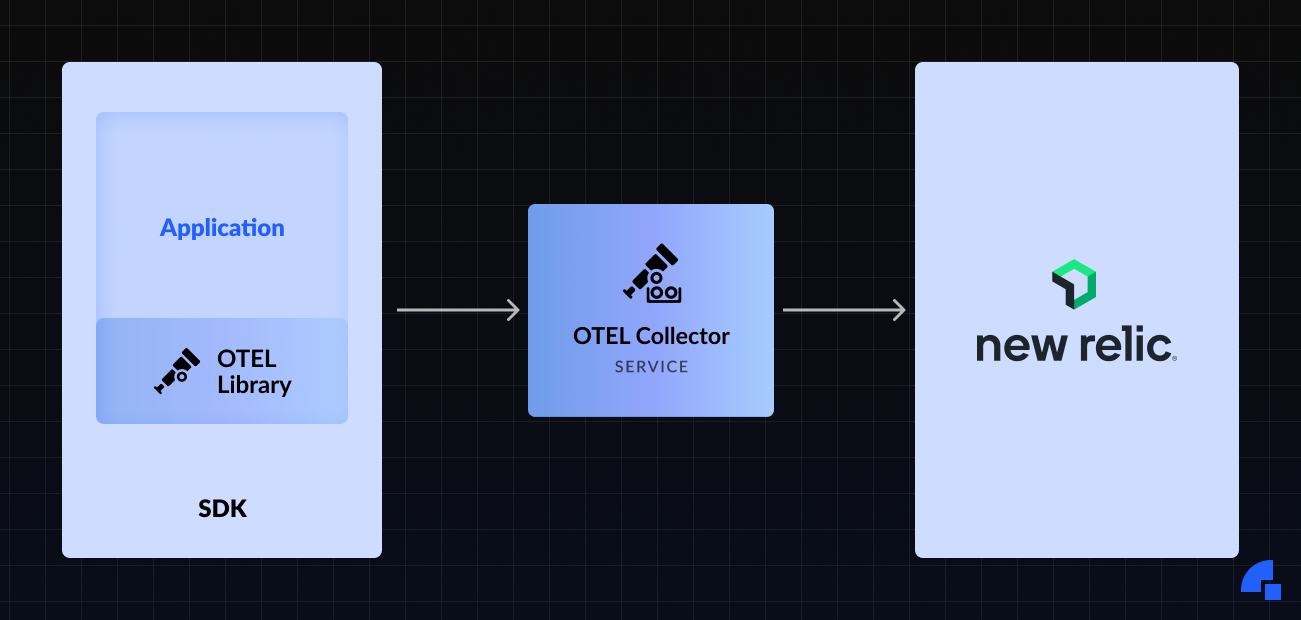
We have our OTEL collector hosted on one of our servers.
We use the following collector config:
receivers:
  otlp:
    protocols:
      grpc: # on port 4317
      http: # on port 4318
        endpoint: "0.0.0.0:4318"
        cors:
          allowed_origins: ["*"]
          allowed_headers: ["*"]
exporters:
  otlp:
    endpoint: "otlp.nr-data.net:443"
    headers:
      "api-key": "YOUR_SECRET_KEY_FROM_NEW_RELIC"
service:
  extensions: []
  pipelines:
    traces:
      receivers: [otlp]
      processors: []
      exporters: [otlp]
    metrics:
      receivers: [otlp]
      processors: []
      exporters: [otlp]
Please refer to https://opentelemetry.io/docs/collector/configuration/ to learn how to set up the OTEL Collector service in one of your BE (backend) servers. This is the most crucial step as it would provide you with the collector URL to which we need to send FE (frontend) traces.
For FE, we use a few OTEL libraries: @opentelemetry/sdk-trace-base & @opentelemetry/context-zone to generate traces and @opentelemetry/exporter-trace-otlp-http to export them. BatchSpanProcessor to batch rather than making individual XHR calls to send spans to New Relic. We will be discussing these libraries later in the blog.
If you still haven’t gone through OpenTelemetry docs, we would suggest that you do it now; click here to refer to OpenTelemetry docs.
Once you go through the examples and the documentation of OpenTelemetry, you will feel like you are writing code inside logs instead of adding logs inside code. This is painful and something which a developer in their right senses won’t want to do.
We didn’t want that. We didn’t do that.
We wanted to alter our code minimally to integrate OpenTelemetry. So we used TypeScript decorator functions.
If you are using plain JS, you can have something similar by overriding functions. https://stackoverflow.com/questions/5226550/can-i-override-the-javascript-function-object-to-log-all-function-calls can give you some idea.
As we are using TypeScript to build our SDK, we created a decorator called trace (a static method in a new class called DyteTelemetry) to use on our functions.
We wrote a new file called opentelemetry.ts to have a separation of concerns.
// opentelemetry.ts
export default class DyteTelemetry {
  public static trace(spanName: string) {
    return (
      _target: Object,
      _propertyKey: string,
      descriptor: PropertyDescriptor
    ) => {
      const originalMethod = descriptor.value;
      descriptor.value = function opentelemetryValueDescriptorFunc(...args: any[]) {
        console.log(`Mesa culled ${spanName}. Mesa your humble span.`);
				const result = originalMethod.apply(this, args);
        return result;
      };

      return descriptor;
    };
  }
}
// someRandomBusinessLogicFile.ts
import DyteTelemetry from './opentelemetry.ts';
// Function before
function whatIsTheMeaningOfLife(){
return 42;
}
// Function after
@DyteTelemetry.trace('fetchingMeaningOfLife')
function whatIsTheMeaningOfLife(){
return 42;
}This basically changes nothing in our mainstream code. All that gets introduced is a new line on top of every function which we want to trace, along with a new file opentelemetry.js.
Now that you know what sort of code design we had in our mind. Let us walk you through our journey, the challenges we faced, and how we rectified them. We will do stuff in FE first, then gradually move to BE to send all our hard work to New Relic or any log aggregator of your choice.
Challenge 1: What all OpenTelemetry packages to use?
import { WebTracerProvider } from '@opentelemetry/sdk-trace-web';
import { OTLPTraceExporter } from '@opentelemetry/exporter-trace-otlp-http';
import { BatchSpanProcessor, Tracer } from '@opentelemetry/sdk-trace-base';
import { ZoneContextManager } from '@opentelemetry/context-zone';
import { SemanticAttributes } from '@opentelemetry/semantic-conventions';
import opentelemetry, { Span, ROOT_CONTEXT } from '@opentelemetry/api';
import { Resource } from '@opentelemetry/resources';
We are using @opentelemetry/sdk-trace-web to create a WebTracerProvider to create a tracer. This tracer has methods available on it to create spans. We use @opentelemetry/resources to create a Resource instance. We need to hold a reference to this tracer throughout this meeting, so we are storing it on DyteTelemetry class as a static variable.
const provider = new WebTracerProvider({
    resource: new Resource({
        'service.name': 'web-core',
    }),
});

DyteTelemetry.tracer = provider.getTracer('any_unique_id');
DyteTelemetry.rootSpan = DyteTelemetry.tracer.startSpan(`main`, {}, ROOT_CONTEXT);

/**
 * Ending the root span instantly.
 * NewRelic recommends not to have active spans which go on for a long time
 * This, however, doesn't impact the ability to create new spans under this span
 **/

DyteTelemetry.rootSpan.end();
any_unique_id gives you the ability to differentiate traces on your log aggregator’s distributed tracing dashboards. We have the peer_PEERID format.
There are times when you want to associate some variables to these spans. Such as the parameters with which these spans were called. You can do so by setting your custom attributes to the span using setAttributes method.
rootSpan.setAttributes({
    "anyKey": "anyValue",
});
Challenge 2: How do we determine the child-parent relationship of these OpenTelemetry spans?
Just writing a decorator to know which method was called is not enough. While debugging & providing live support to customers, we would need to know who called these methods/functions and what were the exact steps they performed to reach this function.
Our core SDK has a lot of classes; most of them are the instances of Event Emitter, meaning that they will listen to a lot of events, and other portions of code might further listen to events emitted by them. So a lot of async stuff will take place.
This brought us to another challenge, how do we keep track of these Async requests and executions?
We were able to do this to a degree using ZoneContextManager. We hope to achieve it with 100% accuracy once browsers support Async Hooks to place hooks in async calls.
There are methods startSpan and startActiveSpan exposed on the tracer, which helps you create spans that help you track their child spans internally. ZoneContextManager keeps track of the caller and callee functions.
You can add the ZoneContextManager to your WebTraceProvider using the register method.
provider.register({
    contextManager: new ZoneContextManager(),
});
// Overridden function's value descriptor.
// Upcoming code snippets will make the position of this code snippet clear.
descriptor.value = function opentelemetryValueDescriptorFunc(...args:any[]) {
const immmediateParentSpan = DyteTelemetry.getCurrentSpan();
const ctx = opentelemetry.trace.setSpan(ROOT_CONTEXT, immmediateParentSpan);
return DyteTelemetry.tracer.startActiveSpan(spanName, {}, ctx, (span) => {
span.setAttributes({
[SemanticAttributes.CODE_FUNCTION]: spanName,
});
const result = originalMethod.apply(this, args);
// if decorated around an async function, wait for it to resolve to end the span
Promise.resolve(result).then(() => {
span.end();
}).catch(() => {
span.end();
});
return result;
});
};Challenge 3: How do we export these traces?
We are using @opentelemetry/exporter-trace-otlp-http to export OpenTelemetry traces. We use BatchSpanProcessor to send the traces in batches to reduce XHR requests otherwise there will be thousands of XHR calls happening from the client’s system.
public static init(peerId:string) {
    const exporter = new OTLPTraceExporter({
        url: 'ENTER_BE_TRACE_COLLECTOR_URL_HERE',
        headers: {
            'anyHeader': 'anyValue',
        },
    });
    const provider = new WebTracerProvider({
        resource: new Resource({
            'service.name': 'NAME_OF_YOUR_APP',
        }),
    });

    DyteTelemetry.tracer = provider.getTracer(peerId)

    provider.addSpanProcessor(new BatchSpanProcessor(exporter));
    provider.register({
        contextManager: new ZoneContextManager(),
        // Zone is required to keep async calls in the same trace
    });

    DyteTelemetry.rootSpan = DyteTelemetry.tracer.startSpan(`peer_${peerId}`, {}, ROOT_CONTEXT);

    DyteTelemetry.rootSpan.end();
}
Final Code - Opentelemetry.ts
import { WebTracerProvider } from '@opentelemetry/sdk-trace-web';
import { OTLPTraceExporter } from '@opentelemetry/exporter-trace-otlp-http';
import { BatchSpanProcessor, Tracer } from '@opentelemetry/sdk-trace-base';
import { ZoneContextManager } from '@opentelemetry/context-zone';
import { SemanticAttributes } from '@opentelemetry/semantic-conventions';
import opentelemetry, { Span, ROOT_CONTEXT } from '@opentelemetry/api';
import { Resource } from '@opentelemetry/resources';

export default class DyteTelemetry {
    public static tracer: Tracer;

    public static rootSpan: Span

    public static init(peerId:string) {
        const exporter = new OTLPTraceExporter({
            url: 'ENTER_BE_TRACE_COLLECTOR_URL_HERE',
            headers: {
                'anyHeader': 'anyValue',
            },
        });
        const provider = new WebTracerProvider({
            resource: new Resource({
                'service.name': 'NAME_OF_YOUR_APP',
            }),
        });

        DyteTelemetry.tracer = provider.getTracer(peerId);

        provider.addSpanProcessor(new BatchSpanProcessor(exporter));
        provider.register({
            contextManager: new ZoneContextManager(),
            // Zone is required to keep async calls in the same trace
        });

        DyteTelemetry.rootSpan = DyteTelemetry.tracer.startSpan(`peer_${peerId}`, {}, ROOT_CONTEXT);

        /**
         * Terminating rootSpan immediately to have a holder span for current peer
         */
        DyteTelemetry.rootSpan.end();
    }

    public static trace(spanName: string) {
        return (_target: Object,
            _propertyKey: string,
            descriptor: PropertyDescriptor) => {
            const originalMethod = descriptor.value;

            /*
                opentelemetryValueDescriptorFunc must be a named function for this propagation,
                It shouldn't be changed to lambda/fat-arrow
            */
            // eslint-disable-next-line no-param-reassign
            descriptor.value = function opentelemetryValueDescriptorFunc(...args:any[]) {
                const immmediateParentSpan = DyteTelemetry.getCurrentSpan();

                const ctx = opentelemetry.trace.setSpan(ROOT_CONTEXT, immmediateParentSpan);

                return DyteTelemetry.tracer.startActiveSpan(spanName, {}, ctx, (span) => {
                    span.setAttributes({
                        [SemanticAttributes.CODE_FUNCTION]: spanName,
                    });

                    const result = originalMethod.apply(this, args);
                    // if decorated around an async function, wait for it to resolve to end the span
                    Promise.resolve(result).then(() => {
                        span.end();
                    }).catch(() => {
                        span.end();
                    });
                    return result;
                });
            };

            return descriptor;
        };
    }

    public static getCurrentSpan() {
        let immmediateParentSpan = opentelemetry
            .trace
            .getSpan(opentelemetry.context.active());

        immmediateParentSpan ??= DyteTelemetry.rootSpan;
        return immmediateParentSpan;
    }

    public static getCurrentSpanName() {
        return (this.getCurrentSpan() as any)?.name;
    }
}
If everything goes as planned, you will see your project with provided service name in New Relic distributed tracing section at https://one.newrelic.com/distributed-tracing. If you are using any other log aggregator, please refer to the log aggregator’s documentation.
Tip: You can add events and exceptions in these spans using span.addEvent and span.recordException methods. This might come in handy to see which span faced the issue. However, we preferred logs over spans to reduce bandwidth usage on the client-side as we have to support very poor and unstable connections, and we can’t risk losing even a few KBs.
Future of OpenTelemetry integration
There are a few pros and cons of OpenTelemetry integration.
Pros:
- Provides a lot of functionality out of the box.
- A strong community to enhance it further.
- Open source specifications.
Cons:
- Integration was painful. Debugging is even more painful. A simple version upgrade without proper changelog and migration steps from the OpenTelemetry side can lead you to a sudden tracing blackout.
- SDKs, built on top of the specs, are way too heavy. It is impractical to add Logs, Traces & Metrics SDKs if the bundle size is a constraint. The community is working on it.
- Lesser documentation about the SDKs.
Based on these, you can decide if OpenTelemetry is the right fit for you. For us, traces was the most useful feature which OpenTelemetry could offer, so we have used SDKs related to OpenTelemetry and skipped Opentelemetry’s logs & metrics integration.
If in the future, SDK sizes reduce to the level we want them to, ideally under less than 300 KB for all-inclusive integration, we might end up adding metrics integration as well. If not, then we will venture into the unknown again to find a better fit.
We wish you luck with your OpenTelemetry integration. We hope that this blog helps you avoid some pain points we faced. If you want the next parts of this tech blog, covering FE logs integrations, backend integration, and so on, please reach out to us.
If you haven’t heard about Dyte yet, head over to https://dyte.io to learn how we are revolutionizing live video calling through our SDKs and libraries and how you can get started quickly on your 10,000 free minutes, which renew every month. If you have any questions, you can reach us at support@dyte.io or ask our developer community.