Dyte is in the business of providing audio/video calls to developers and users worldwide. We hold ourselves to the same standards of quality and responsiveness that we expect of all the developer tooling we use daily, as we firmly believe that is the only way to gain long-term customer trust. To achieve this, we must ensure that our systems are always provisioned with sufficient capacity for large traffic surges but without burning holes through our wallets. If you’ve ever experimented with the Dyte APIs, you have interacted with our REST APIs. Scaling REST APIs is a relatively well-understood problem and can be solved with foresight and careful capacity planning. However, the systems that handle the actual audio/video streams are a unique breed, and very few folks understand their semi-stateful nature and scaling patterns. We’ve made some progress on scaling these systems effectively, and we’d love to share our story so far and some of our following challenges.
When the included batteries don’t work
One of the biggest challenges we face with scaling our media layer is the need for fine-grained control on scaling up and down this layer. Scaling down is especially tricky as we need to ensure there are no ongoing meetings on the nodes that we choose to terminate. Most of our services are hosted on Kubernetes, including the media layer. Kubernetes is excellent when it comes to managing and orchestrating stateless services, but the developer and operator experience is particularly tricky for stateful services.
Our first, obvious attempt was to use StatefulSets to provision the media nodes. Scaling up a StatefulSet is straightforward; Kubernetes adds one additional node in the set at the end. However, while scaling down, it terminates media nodes in reverse order. This goes against the general nature of meetings/video calls we’ve observed. Meetings that start last rarely, if ever, end first. Usually, the meeting that starts first will end first. As a result, we would need a FIFO approach to scaling down, as against StatefulSet’s default LIFO approach. Hence, this attempt was a no-go.
Building our own
Next, we wrote a custom Autoscaler service to tackle this situation. The service relies on custom Prometheus metrics like the number of meetings already allocated to each room node, as well as a total number of participants to estimate the load on each node, instead of relying on crude metrics like CPU and memory consumption. The service periodically polls each media node, computes the load on each of them, and marks them as overloaded if the custom metrics are above certain thresholds. If even one media node is overloaded, scaling up is now straightforward, we spin up additional media nodes to serve the traffic.
On the other hand, as load decreases and nodes no longer have meetings running on them, they need to be scaled down. In the polling cycle, the Autoscaler notices this situation, and media nodes with no traffic are marked. The service that allocates meetings to media nodes reads this annotation and stops assigning new meetings to these nodes. After a specified cooling down period, if the overall traffic on the system has not increased, we terminate nodes.
As with any other scaling system, this service has guard rails defined in terms of minimum and maximum nodes that should exist in each media region. And, buffer capacity is always maintained to accept additional traffic as provisioning additional capacity is not instantaneous.
This served us well, until it did not.
Enter Toil
On some days, we know that we will have additional meetings to host, and our systems should be scaled up beforehand to service this capacity. Adding a new media node requires time in the order of minutes, not seconds, and hence, a large set of meetings starting on a schedule would burn through the buffer capacity in a matter of seconds. To avoid negatively impacting our end users, we need to take control of the system and force the Autoscaler to provision more nodes by changing the minimum nodes setting a few minutes before the scheduled start of the meetings. And, once the meetings ended, we needed to revert the minimum nodes setting to scale down media nodes.
This was highly inefficient because:
- This was a reactive approach, and we wanted something proactive.
- This was not always cost-effective, as we would overprovision the systems.
- It was highly manual! Every time, a team member would have to make changes to scale up/down before/after these spikes.
The Autoscaler needed some sort of Smartness (Artificial Intelligence ?) 😊
Rise of Load Predictor
We’ve been working with our customers for quite some time now and have recognized that there is a seasonality in the amount of traffic we receive. We could exploit this insight and reduce the effort introduced by manual toil while still meeting the expectations of quality and responsiveness of our customers and also staying cost-effective.
Due to the way the Autoscaler works, we have collected a good amount of metrics on a per-node basis on the historical traffic patterns that our systems tackle. Therefore, we already had aggregate trends of the traffic against the time of the day and week. We used this data to build a simple model of the expected traffic on our system, and estimate the number of expected nodes with a new service, the Load Predictor. This data can be provided to the Autoscaler service, and it scales the media nodes up or down based on this data.
The prediction model is extremely simple - we look at traffic from the past hour, traffic from yesterday, and traffic from a week ago at the same time of the day, and compute a weighted average. We compute this metric every 5 mins and attempt to look 15 minutes ahead, giving the system sufficient time to provide additional nodes for the expected traffic.
A block diagram shows the flow of information between the various components involved in this process:
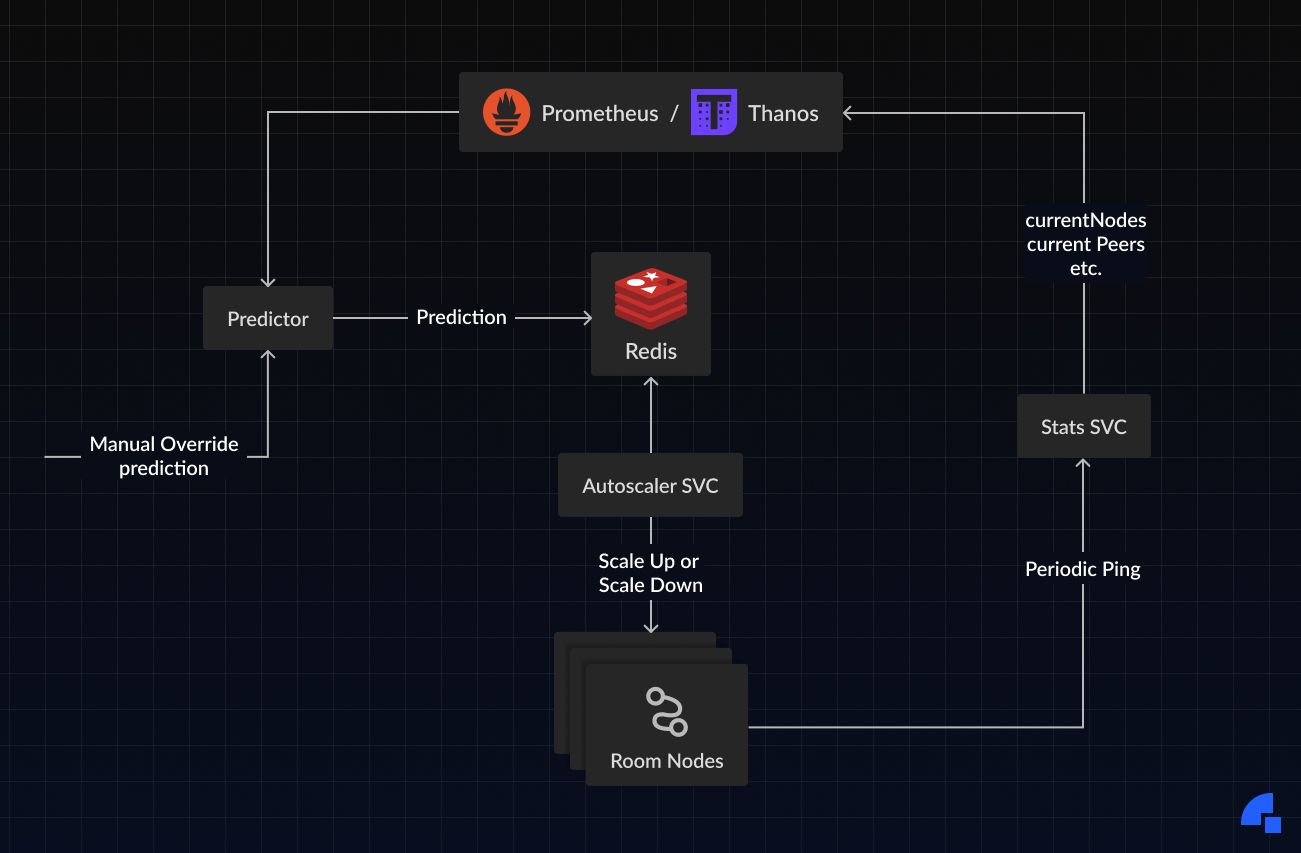
This system has proved very effective for our traffic pattern, and we rarely need to manually intervene in scaling the media services.
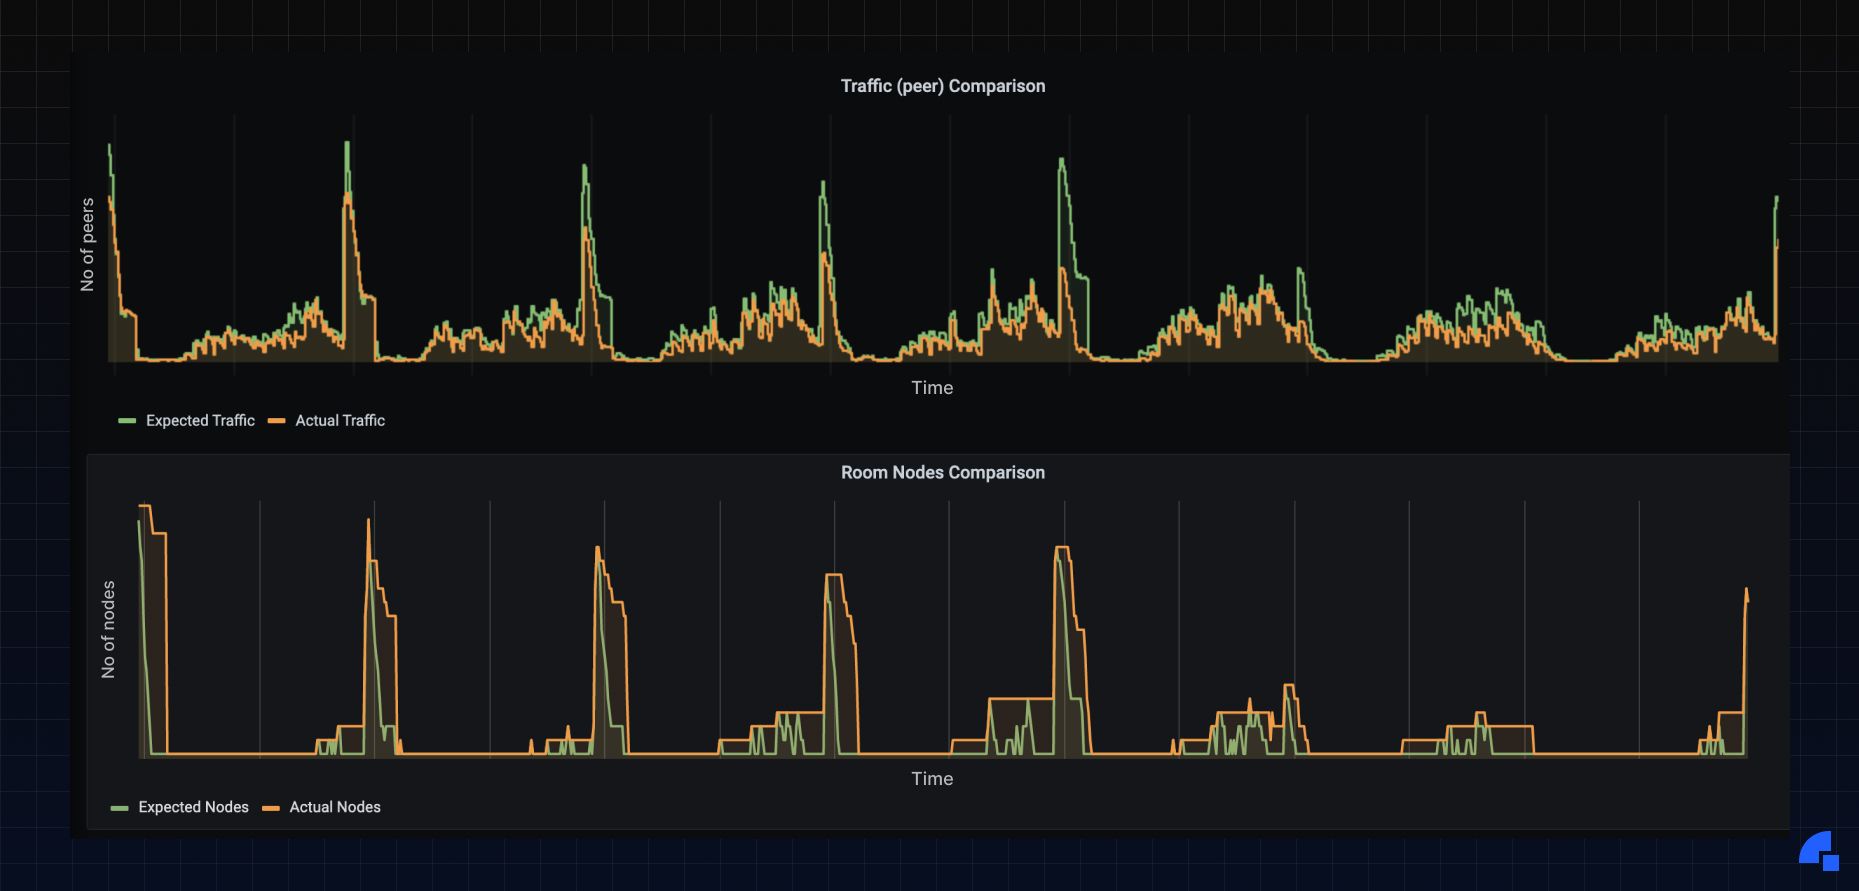
A snapshot of the effectiveness of the scaling system from our Grafana dashboards tells us that we’ve achieved most of what we’d set out to do:
- This is a lot more cost-optimized as it does not overprovision the system like before.
- It is automatic!
Of course, this is not a foolproof system yet; we have to take manual control whenever there is an unexpected surge in traffic.
Next Steps
We need to offer a dashboard for manually setting the traffic or min size. And next step in prediction is that the current ML prediction logic is based on simple aggregation; we are working on using better algorithms for better and more optimized predictions. By relying on Machine Learning techniques, we can more effectively predict the scheduling of meetings and ensure sufficient capacity is provisioned for our customers and users. This should further reduce the toil on our teams, leading to a more productive and happy set of engineers.
If this kind of challenge excites you, head over to Dyte Careers for job openings. And if you haven’t heard about Dyte yet, head over to https://dyte.io to learn how we are revolutionizing live video calling through our SDKs and libraries and how you can get started quickly on your 10,000 free minutes which renew every month. If you have any questions, you can reach us at support@dyte.io or ask our developer community.